Category:
 Author:
 Date:Jun 30, 2026
Trend Alignment: How Traders Profit From Short-Term Conflict
Markets rarely move on one clean line. A strong medium-term trend can still get interrupted by a sharp short-term pullback that makes the next move look uncertain, even reversed. What separates traders who profit from that moment from those who freeze is whether they can stay anchored to the bigger picture while the smaller one is still arguing against
them. Hoc-trade calls this pattern trend alignment, and it shows up clearly across real trading data.
What is trend alignment in trading?
Trend alignment is a trader's ability to enter a position that runs against the short-term trend, but that lines up with the medium-term trend, and to come out ahead because of it. It shows up when short-term and medium-term signals disagree, often because a pullback is happening inside a bigger, still-intact trend. Rather than treating that disagreement as a red flag, the trend alignment trader treats it as a chance to join the larger move at a better price once the pullback runs out of steam.
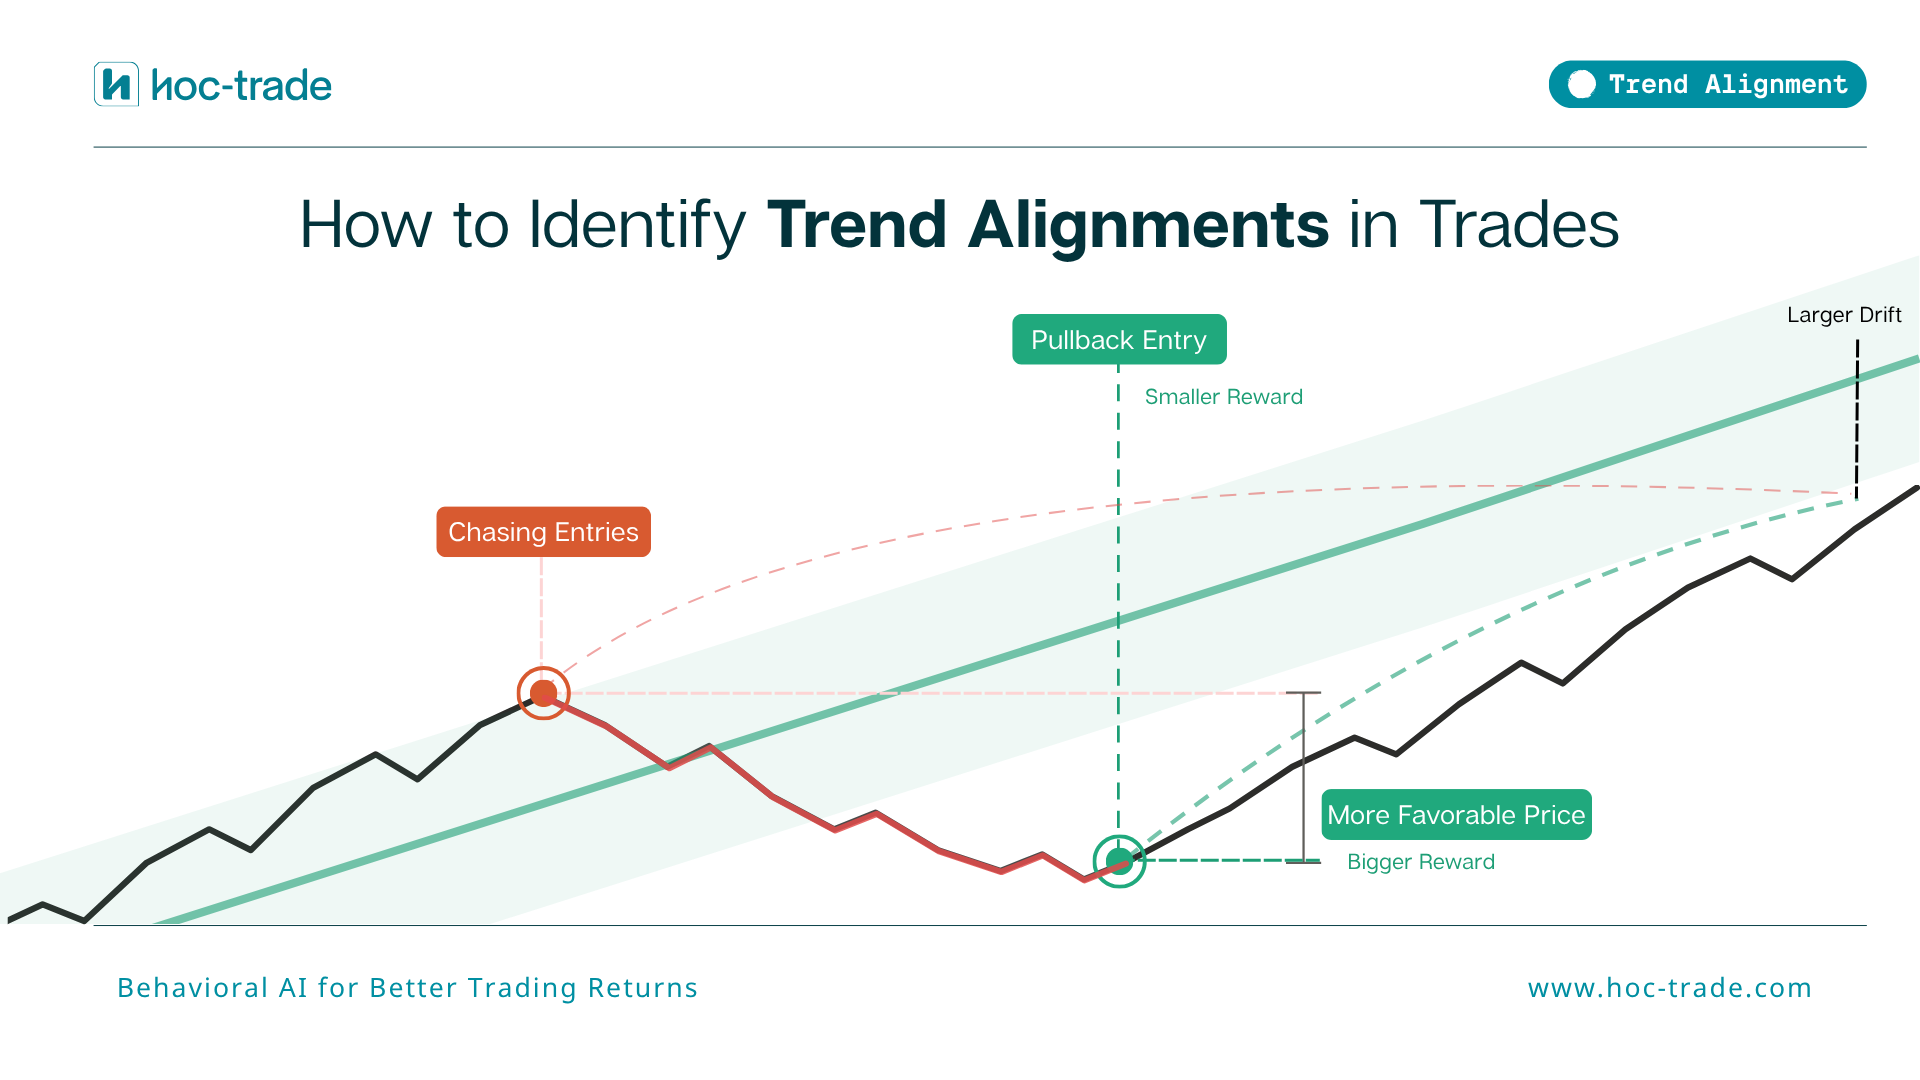
Picture EUR/USD climbing steadily on the H4 chart for several days straight. Then the M15 chart starts printing a sharp drop. Price breaks through minor support, short-term momentum flips bearish, and most traders would read that as a signal to wait or exit. A trend alignment trader reads it differently. They watch the selling candles shrink, momentum slow, and the medium-term structure hold. They step in long while the short-term picture still looks shaky, because the pullback is fading and the bigger trend is still very much alive.
How does trend alignment show up in real trades?
In practice, trend alignment means entering while the short-term trend is still pointing the wrong way, with the trade justified by the medium-term direction. Timing is everything here. The entry tends to land close to where the short-term pullback is running out of energy and the broader trend is starting to take back control. The correction becomes a chance to improve entry price, not a reason to sit out.
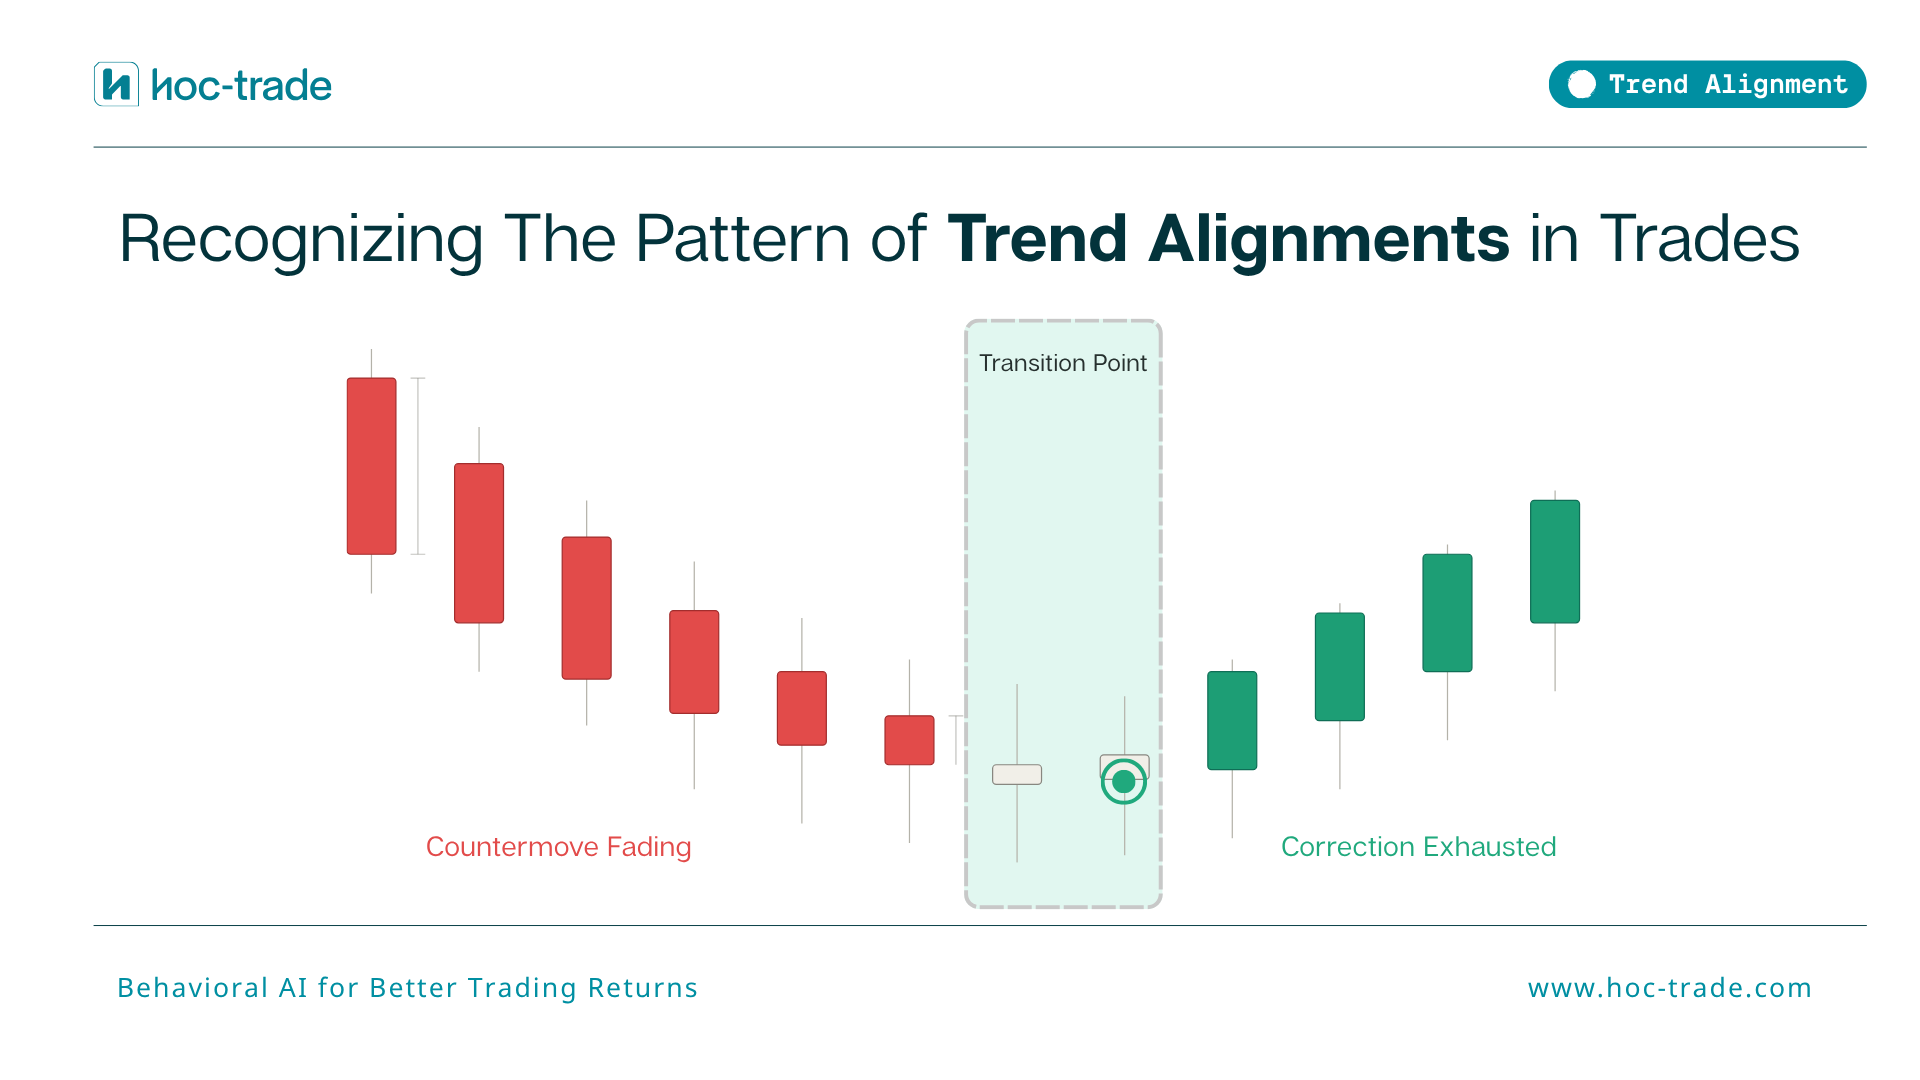
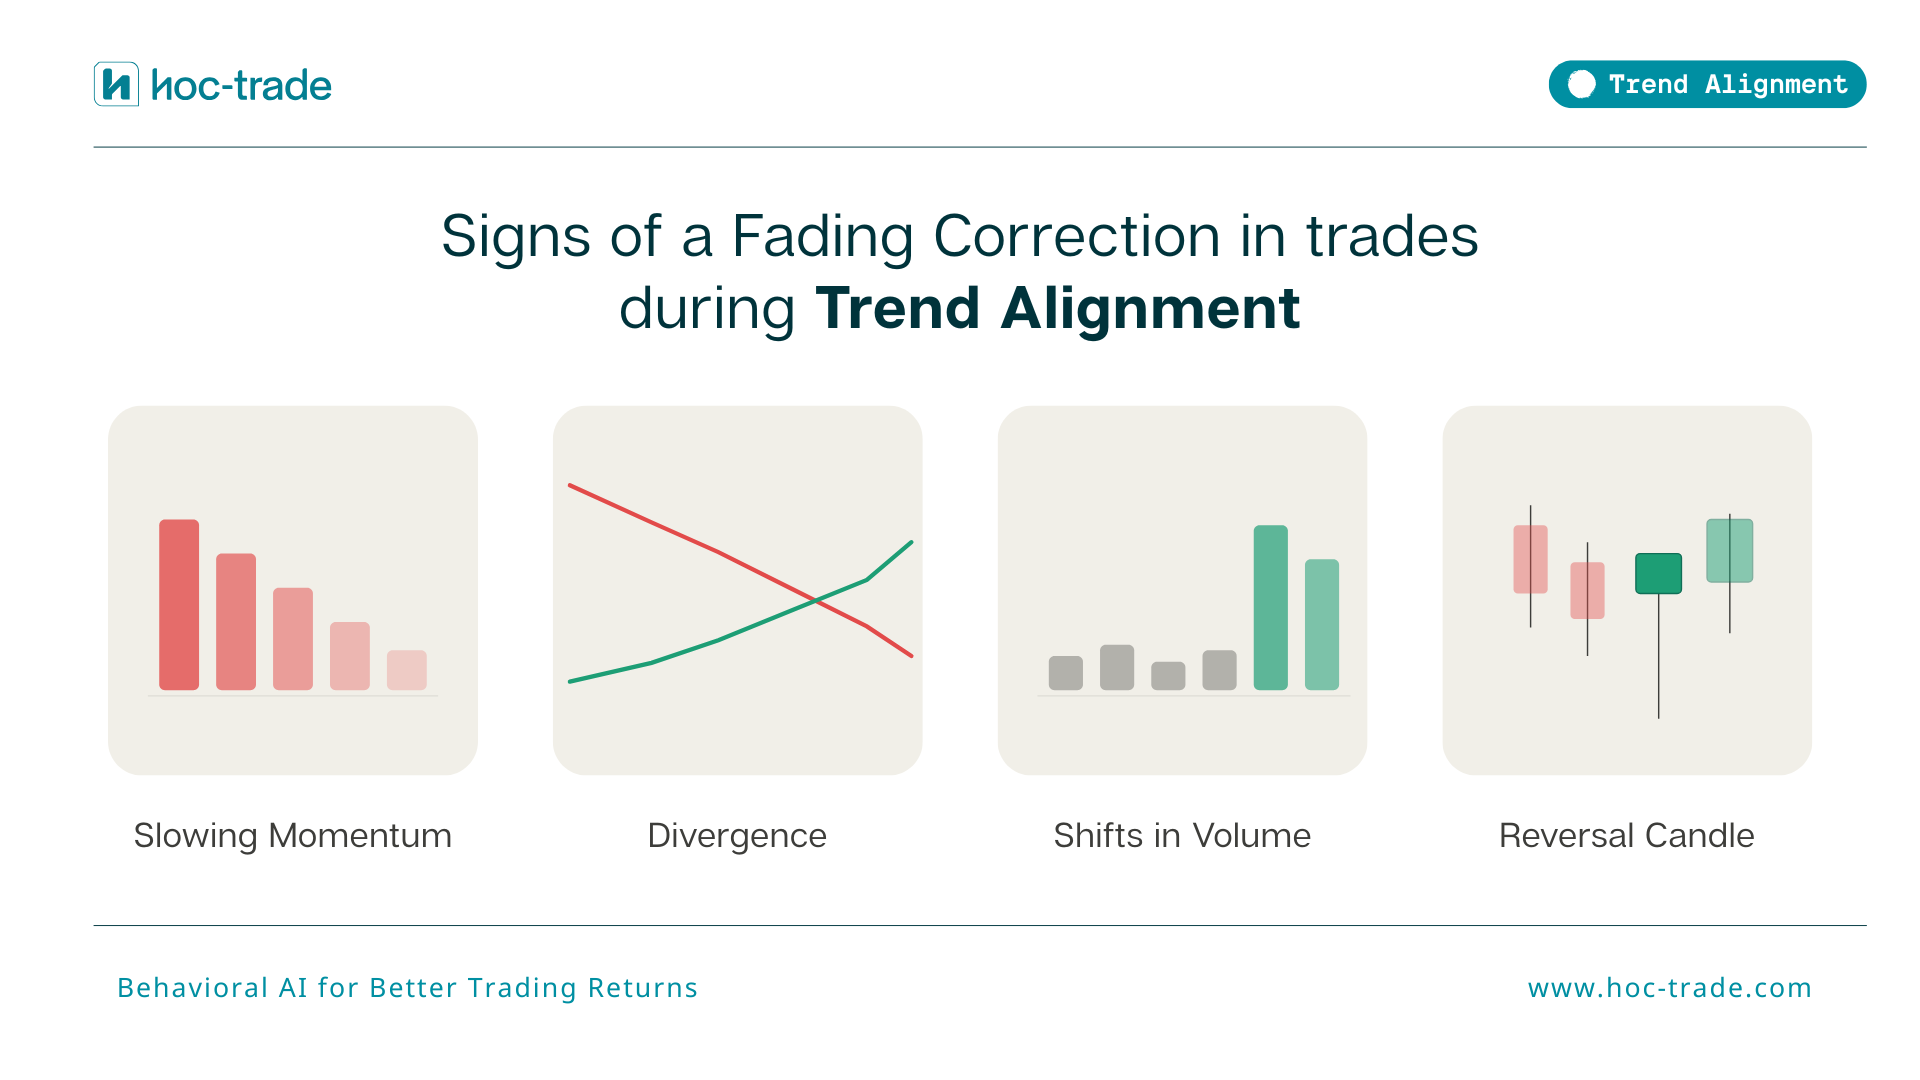
Traders reading this setup look for the pullback losing strength through slowing momentum, divergence on an indicator, a shift in volume, or reversal candle patterns. The medium-term trend gets established first. Only then does the short-term chart get used, to check whether the correction is running out of road. When this reads cleanly, the entry lines up with the medium-term direction even as it goes against the short-term move that created the opportunity.
Why is trend alignment considered a trading edge?
The edge sits in a specific, repeatable kind of ambiguity: a market that is still biased in one direction over the medium term while briefly contested in the short term. It is easy in that window to mistake a correction for a full trend change, or to get pulled into reacting to short-term noise and lose sight of the bigger picture. Trend alignment keeps the medium-term direction as the anchor and treats the correction itself as the window worth trading.
Because the logic is tied to a recognisable market environment rather than to any single trade outcome, this framing tends to support steadier execution over time. When the broader trend resumes after the correction, the move that follows can be sizeable, which is part of why the reward-to-risk profile on these trades tends to look attractive.
Why do the best trend alignment entries often feel wrong?
Most traders wait until every timeframe agrees before pulling the trigger. That feels like the safer choice, since the short-term chart is confirming what the medium-term chart already showed. The problem is timing: by the point everything lines up, the pullback is over, the best price has already gone, and the trade has resumed without you. What is left is chasing a move that is already underway rather than getting ahead of it.
Trend alignment lives in the space between those two timeframes. The medium-term chart supplies conviction. The short-term chart supplies the price. The skill is not waiting for full confirmation that the correction has reversed, it is recognising when the correction is losing energy before that confirmation ever arrives. That is exactly why the best entries tend to feel uncomfortable in the moment: the short-term chart is still arguing the other way while you act on the structure that has not caught up to it yet.
How does Hoc-trade detect trend alignment?
Hoc-trade looks for trades taken against the prevailing short-term trend but in step with the medium-term trend, then checks whether that specific subset of trades outperforms the trader's overall average. A positive correlation between that subset and average performance is the marker TradeMedic uses to flag trend alignment as an identified strength.
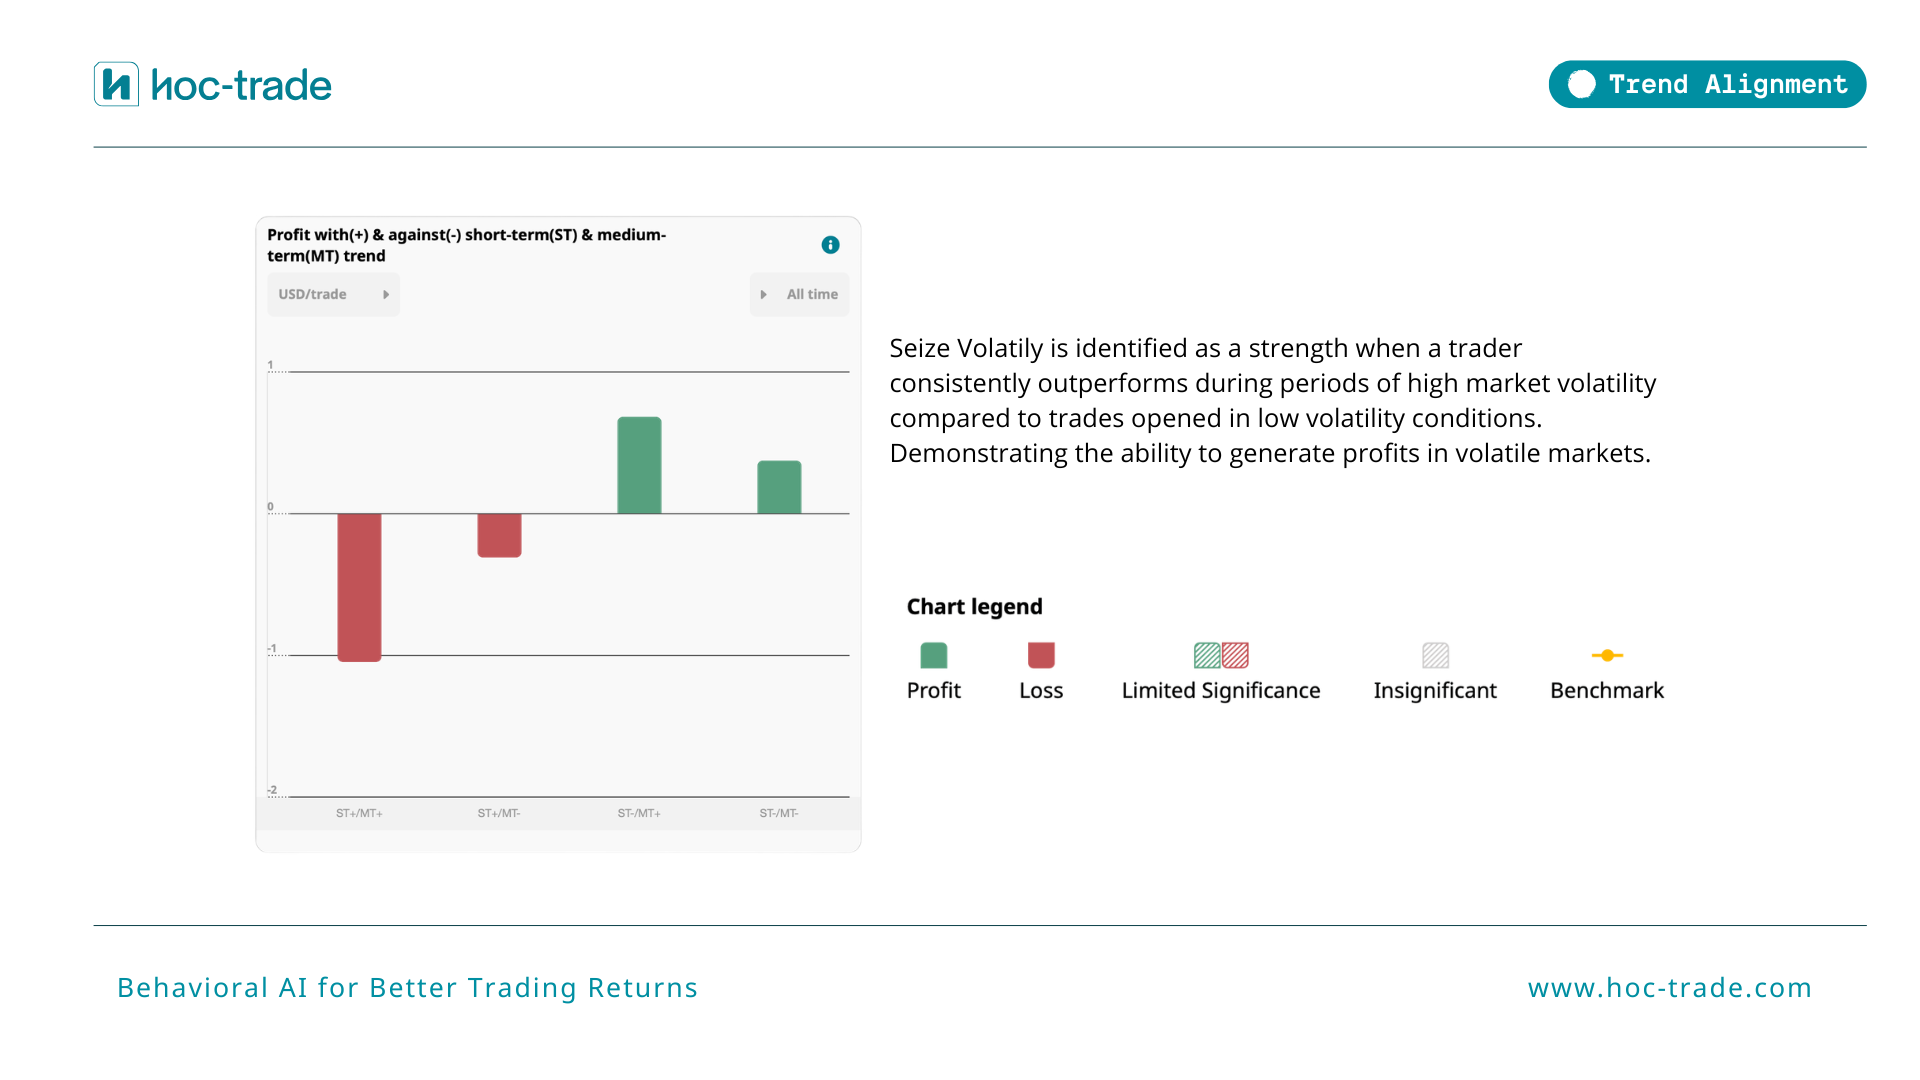
Trades are classified using short-term and medium-term moving averages on the M15 and H4 charts to define what counts as short-term versus medium-term trend. From there, TradeMedic compares performance across those classifications and surfaces whether stronger results cluster specifically around entries that oppose the short-term move while matching the medium-term direction. Traders working through this kind of self-review often notice similar dynamics in counter-trend trading and momentum trading, where timeframe conflict plays a comparable role.
What does the data say about trend alignment?
TradeMedic AI tracks trend alignment across a dataset of 500,000+ trader accounts, scoring each trader's personal tendency to catch, or miss, these medium-term resumptions after a short-term correction. In our data, trend alignment shows up as one of the clearer markers separating traders who consistently ride out corrections from those who exit or reverse too early. A full statistical breakdown of trend alignment performance is part of our ongoing research, with a dedicated data analysis to follow.
Trend alignment gets easier to spot as the sequence becomes familiar: medium-term direction established first, short-term correction observed, entry timed to when that correction is losing steam and the broader trend is reasserting itself. What separates this from reactive counter-trend trading is the dual-timeframe read and the patience to wait for real signs the short-term move is fading, rather than waiting for a full reversal.
Over a large enough sample, the strongest results tend to repeat in the same conditions, in the same alignment window, at the same kind of transition. That consistency is what turns trend alignment from an occasional lucky trade into a stable, repeatable contributor to long-term performance. Traders using TradeMedic can see exactly where this pattern shows up in their own trading history.
TradeMedic AI analyses over 60 behavioral patterns, including Trend Alignment as a trading strength, across 500,000+ trader accounts. Visit TradeMedic to see how it works.
Watch How Trend Alignment is A Trading Edge
Frequently asked questions
What is trend alignment in trading?
Trend alignment is a trader's ability to profit from entering a trade that goes against the short-term trend but matches the medium-term trend. It typically appears when a short-term correction is unfolding inside a larger, intact trend. TradeMedic tracks this pattern across more than 500,000 trader accounts.
How is trend alignment different from counter-trend trading?
Counter-trend trading works against the dominant trend on any timeframe, while trend alignment specifically works against the short-term trend in service of the medium-term trend. The medium-term direction stays the primary conviction, and the short-term move is only used to time a better entry price. This distinction is part of why trend alignment can outperform where undisciplined counter-trend trading often does not.
Why do good trend alignment entries feel uncomfortable?
Because the short-term chart is still moving against the position at the moment of entry, even though the medium-term trend supports it. Waiting for full agreement across timeframes usually means the best price has already gone and the move has resumed without you. The discomfort is part of the edge, not a sign the trade is wrong.
How does Hoc-trade measure trend alignment in trading data?
Hoc-trade classifies trades using short-term and medium-term moving averages on the M15 and H4 charts, then checks whether trades taken against the short-term trend but aligned with the medium-term trend outperform a trader's average results. A positive correlation between that subset and overall performance is what identifies trend alignment as a trader's strength.