Category:
 Author:
 Date:Jul 13, 2026
Low Volatility: The Boring Skill That Separates Profitable Traders From Loss-Makers
Here is a finding that runs against almost everything traders are taught: the single cleanest marker of a profitable trader is not skill in fast, volatile markets. It is the ability to trade well when volatility is low, in the quiet, boring stretches most traders can't wait to escape. Across more than 500,000 trader accounts, 59% of profitable traders show this low-volatility strength, versus just 12% of loss-makers. The high-volatility skill everyone chases separates the two groups about five times less clearly.
We call this strength Strive in Calm Markets, and the numbers behind it are hard to ignore: traders who have it are far more likely to be profitable, it holds across every trading style, and it grows the longer a trader survives in the market. Below is what the behavioral data shows, the psychology behind why quiet markets are so revealing, and how you can build the skill yourself.
How to trade low volatility: what it means to perform in quiet markets
Low-volatility trading means performing well in the quiet stretches of the market, the sessions where price is going nowhere, there are no major news events, and the ranges are tight. Most traders find these conditions boring. There is nothing forcing a move, nothing obvious to react to, and no momentum to carry a position.
Trading well in these conditions rewards a different skill than fast markets do. The profit comes from consistent, gradual gains rather than from catching one big move. There is no sharp swing to blame when something goes wrong, and no breaking news to react to. What is left on the screen is the raw quality of your process: your patience, your selectivity, and whether you can sit on your hands when there is no real setup.
Why do most traders chase volatility instead?
The pull toward volatile markets is a very human thing. We are wired to want stimulation and to value doing something over doing nothing. A fast, moving market gives you constant feedback, a sense of action, and the feeling that money is being made and lost in real time. A quiet market gives you none, or at least much less, of that.
The problem is that this instinct is not always helpful in trading. Traders who need the market to be exciting to stay engaged tend to force low-quality trades when nothing is happening, simply to have something to do, maybe even oversize and overtrade these trades so they feel the rush and dopamine. And as the data below shows, the skill everyone chases, performing in high volatility, turns out to be a surprisingly weak signal of who makes money.
How low-volatility skill separates profitable traders from losers
Across more than 500,000 trader accounts, 59% of profitable traders show strength in calm, low-volatility markets. Among loss-making traders, only 12% do. That is one of the widest gaps we see between the two groups for any behavioral pattern we track. For reference: 18% of traders were profitable overall.
Put the other way around, the signal is even clearer: among traders who do not have this strength, only about 1 in 10 are profitable. Among those who do have it, more than half are. This is a correlation rather than proof that the skill causes profitability, but as a marker of who is making money, it is about as clean as they come. It also ranks as the third most common strength among profitable traders overall.
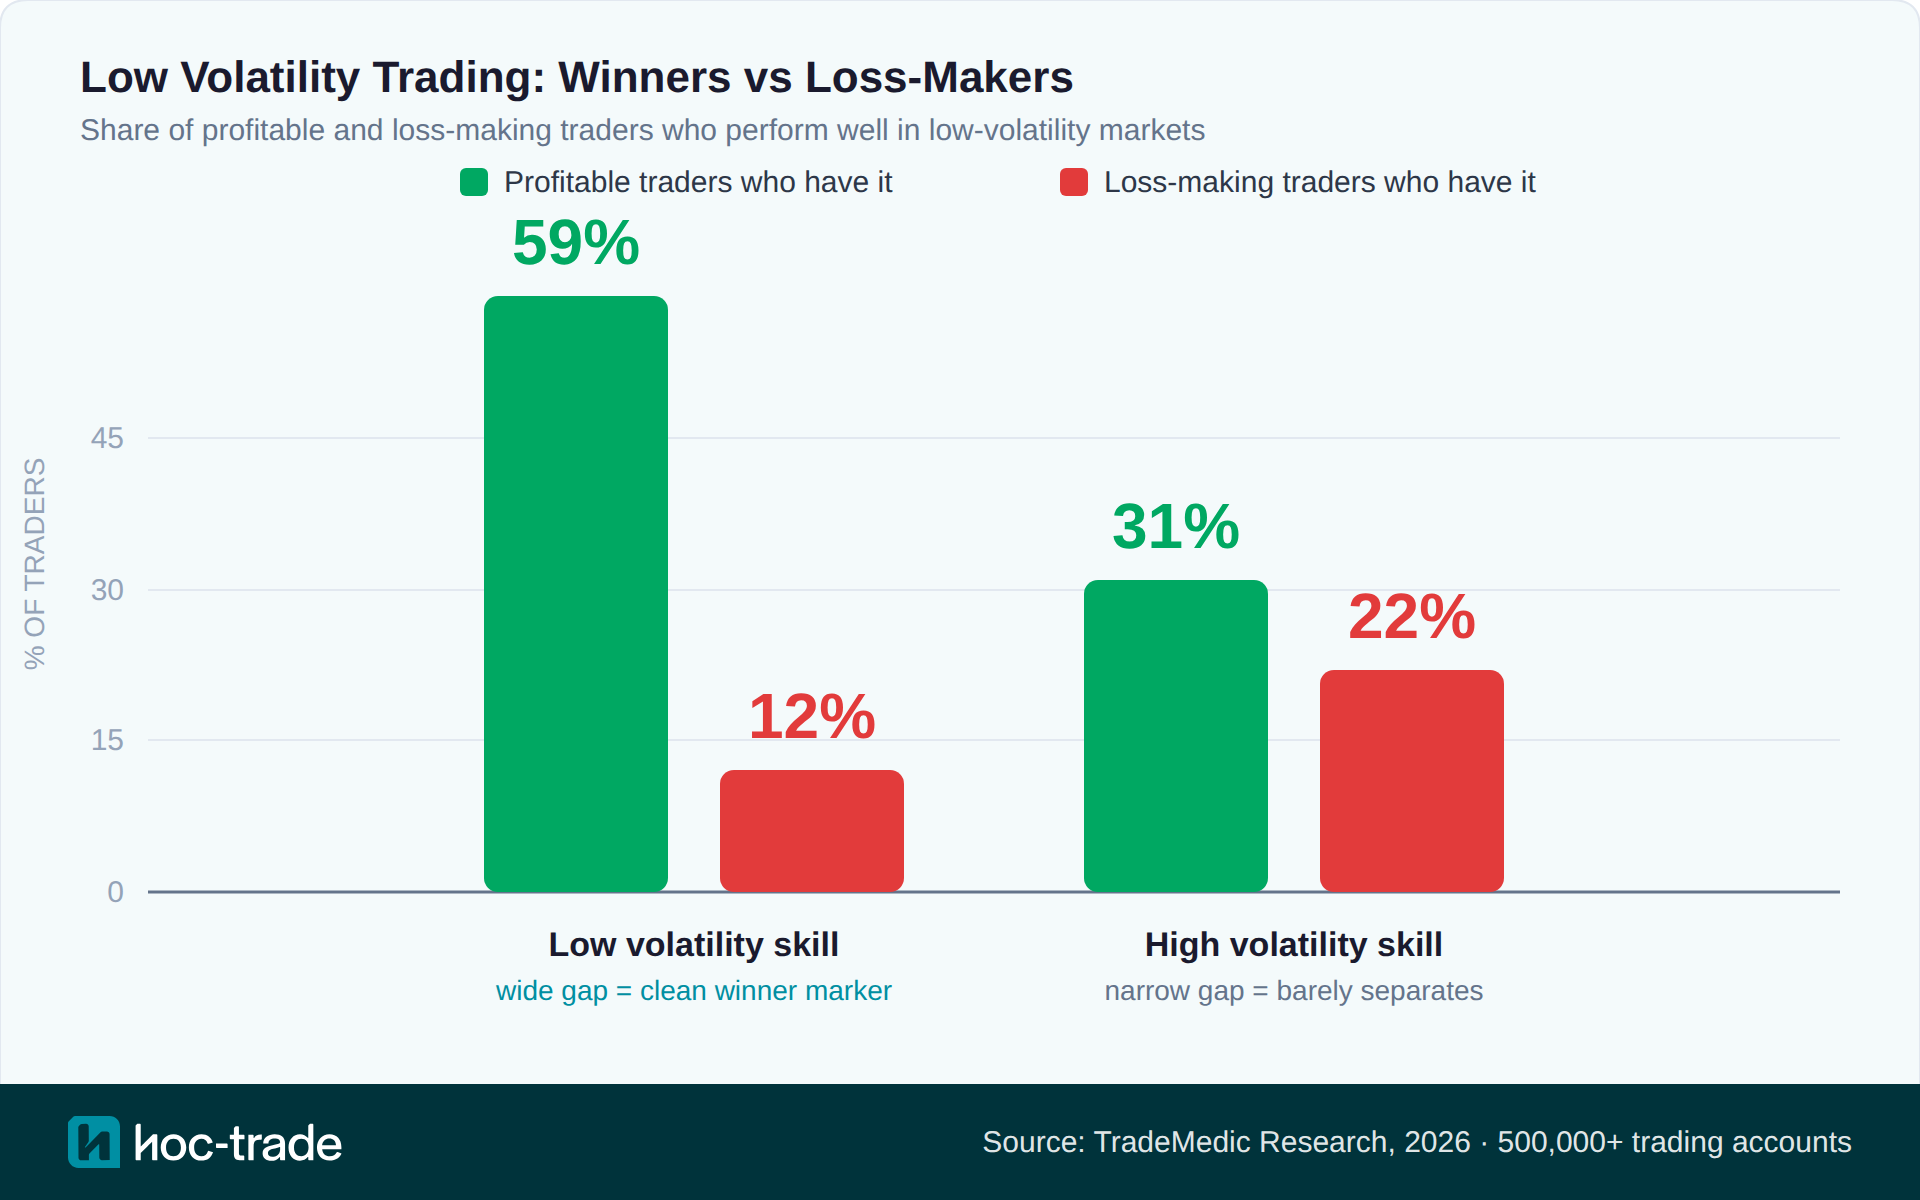
The comparison that makes this striking is the opposite skill. Performing well in high volatility, the fast-market skill most traders want to master, shows up in 31% of profitable traders and 22% of loss-makers (note, in our data every trader can only have one of the two). That is a real gap, but a small one. The high-volatility skill barely separates winners from losers. The low-volatility skill separates them roughly five times more cleanly. The skill everyone chases is a weak signal, and the boring one nobody talks about is a strong one.
Source: TradeMedic Research, 2026.
Does low-volatility and sideways market trading suit a particular style?
Not really, and that is part of what makes it interesting. Most behavioral patterns lean heavily toward one trading style. This one is nearly flat: swing traders show it slightly more often (around 25%), followed by day traders (around 20%) and scalpers (around 19%). The spread is small. Sideways market trading, where price chops in a range and goes nowhere, is one of the clearest examples of the low-volatility conditions this strength rewards, and it shows up across all three styles.
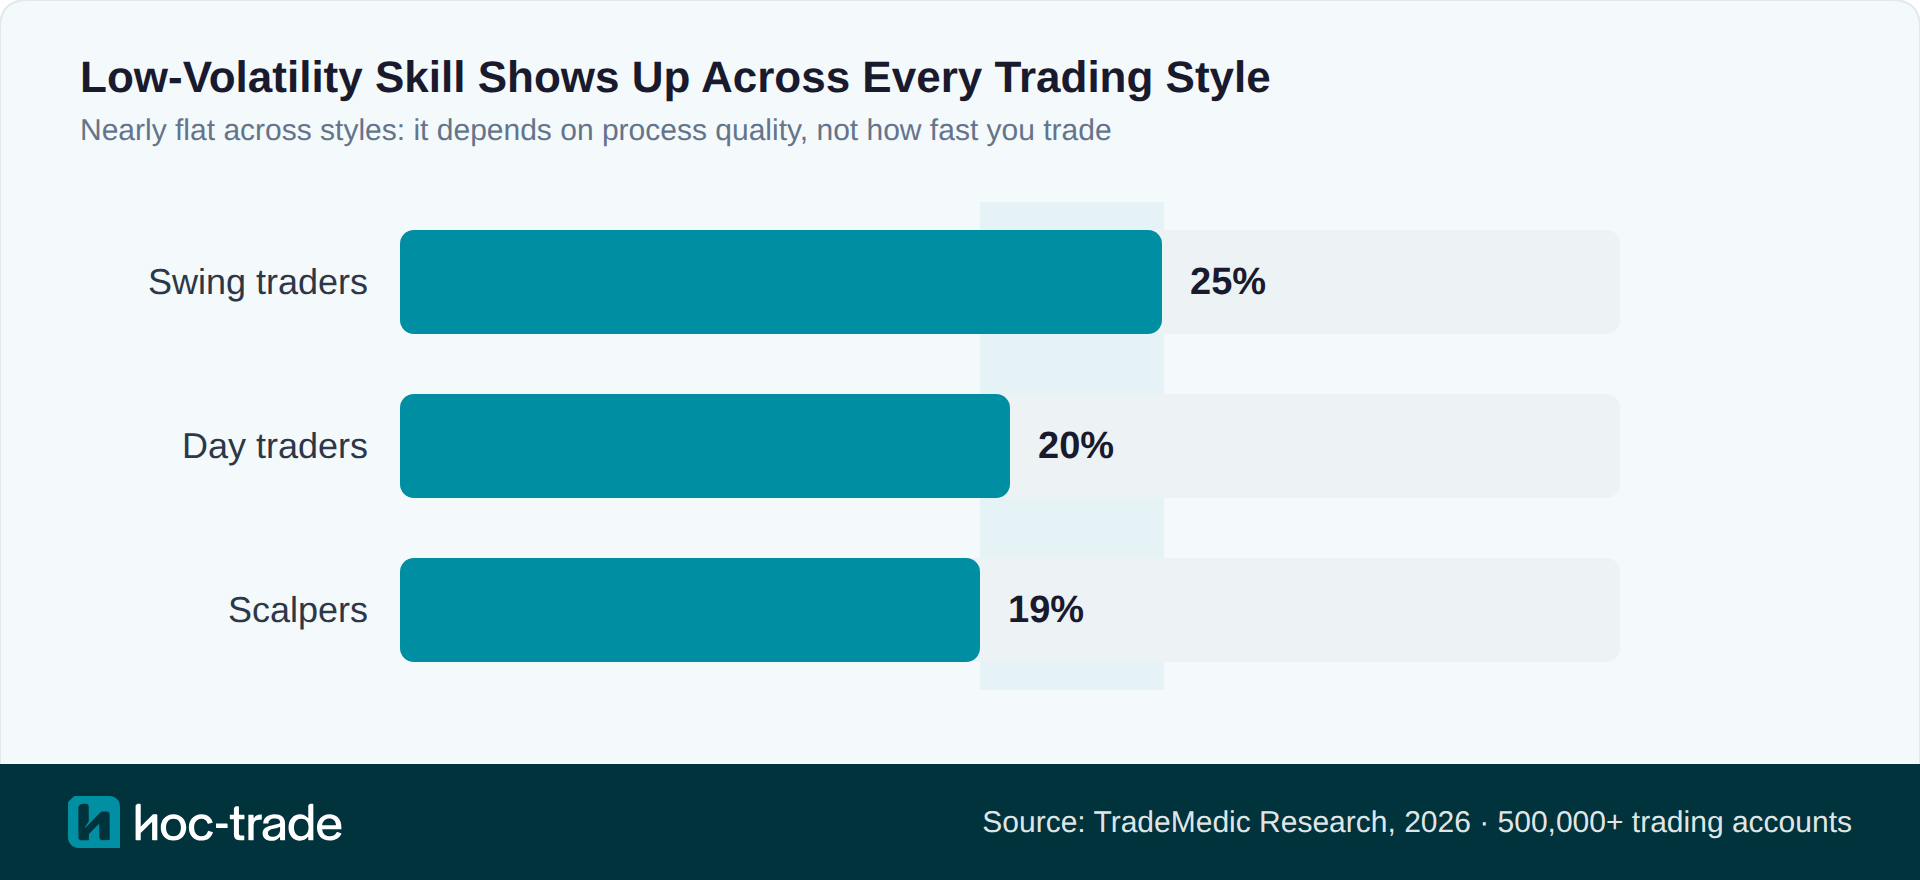
The reason it holds across styles is that it is not about how fast you trade. It is about the quality of your process, and process quality is not tied to a timeframe. A disciplined scalper and a disciplined swing trader can both perform in the quiet. This is also why it applies to almost every trader, not just a niche of range traders.
Does low-volatility performance grow with experience?
It appears to, yes. The strength gets more common the longer a trader has been active, from around 17.5% of traders in their first 10 active days to around 25% for traders past 200 days.
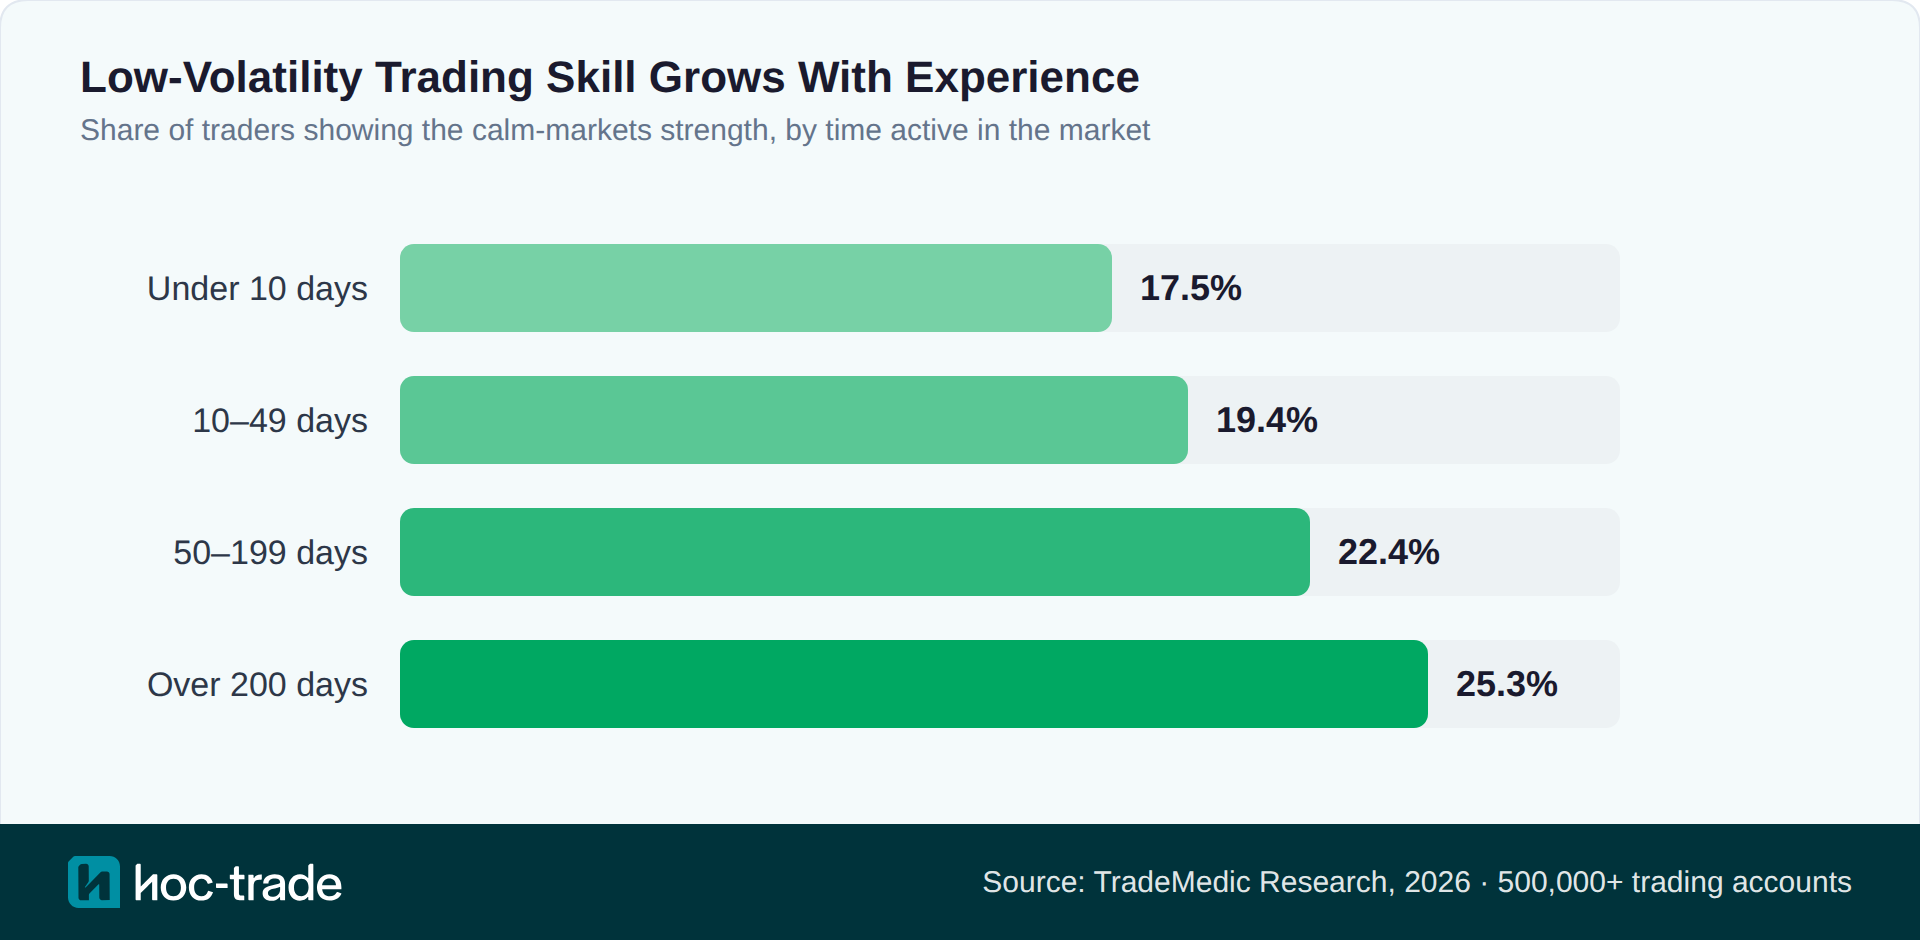
There are two honest readings of this, and the data cannot fully separate them. Either the skill really develops as traders spend more time in the market and learn to handle the quiet, or the traders who already have it are simply the ones who last long enough to reach the experienced group, while those who need constant action tend to leave early. It is probably some of both. Either way, it reads as a marker of trading maturity rather than something you either have on day one or never get.
Why patience in trading matters most when markets are quiet
Patience in trading is easy to talk about and hard to measure, but quiet markets are exactly where it becomes visible. When there is nothing forcing a move, the trader who waits for a real setup and the trader who takes the marginal trade in front of them end up with very different results.
This connects to a well-studied idea in psychology: delayed gratification, the ability to pass up a small reward now for a larger one later, made famous by the marshmallow experiments. In a quiet market that is precisely the skill required. Waiting for the genuine setup instead of the marginal one is the entire game, and the traders who cannot wait take the marginal trade. In the quiet, those marginal trades are usually the ones that lose.
So low-volatility performance is, in at least a significant part, a patience test. The traders who pass it are not doing anything flashy. They are simply choosing to do nothing until the market gives them a real reason to act, staying focused on the few high probability set-ups this market environment produces.
The psychology: why some traders can't sit still in quiet markets
Beyond patience, a couple of other well-researched factors help explain who struggles when the market goes quiet. The individual findings below are established research; the way they connect to calm-market performance is our interpretation.
The first is sensation seeking. Research linking personality to real trade records has found that high sensation-seekers trade far more often, chasing stimulation rather than edge. A quiet market gives the thrill-seeker nothing to act on, so they either force low-quality trades out of boredom or disengage entirely, with many doing the former. Traders lower in sensation-seeking are much more comfortable doing nothing when there is nothing to do.
The second is the arousal-performance curve, the classic inverted-U relationship where performance is sharpest at moderate arousal and worse at both extremes. On a real trading floor, researchers measured cortisol, a stress hormone, rising as market volatility increased. High volatility literally pushes traders up and over the top of that curve, into the zone where judgment degrades. Calm markets keep you nearer the sweet spot.
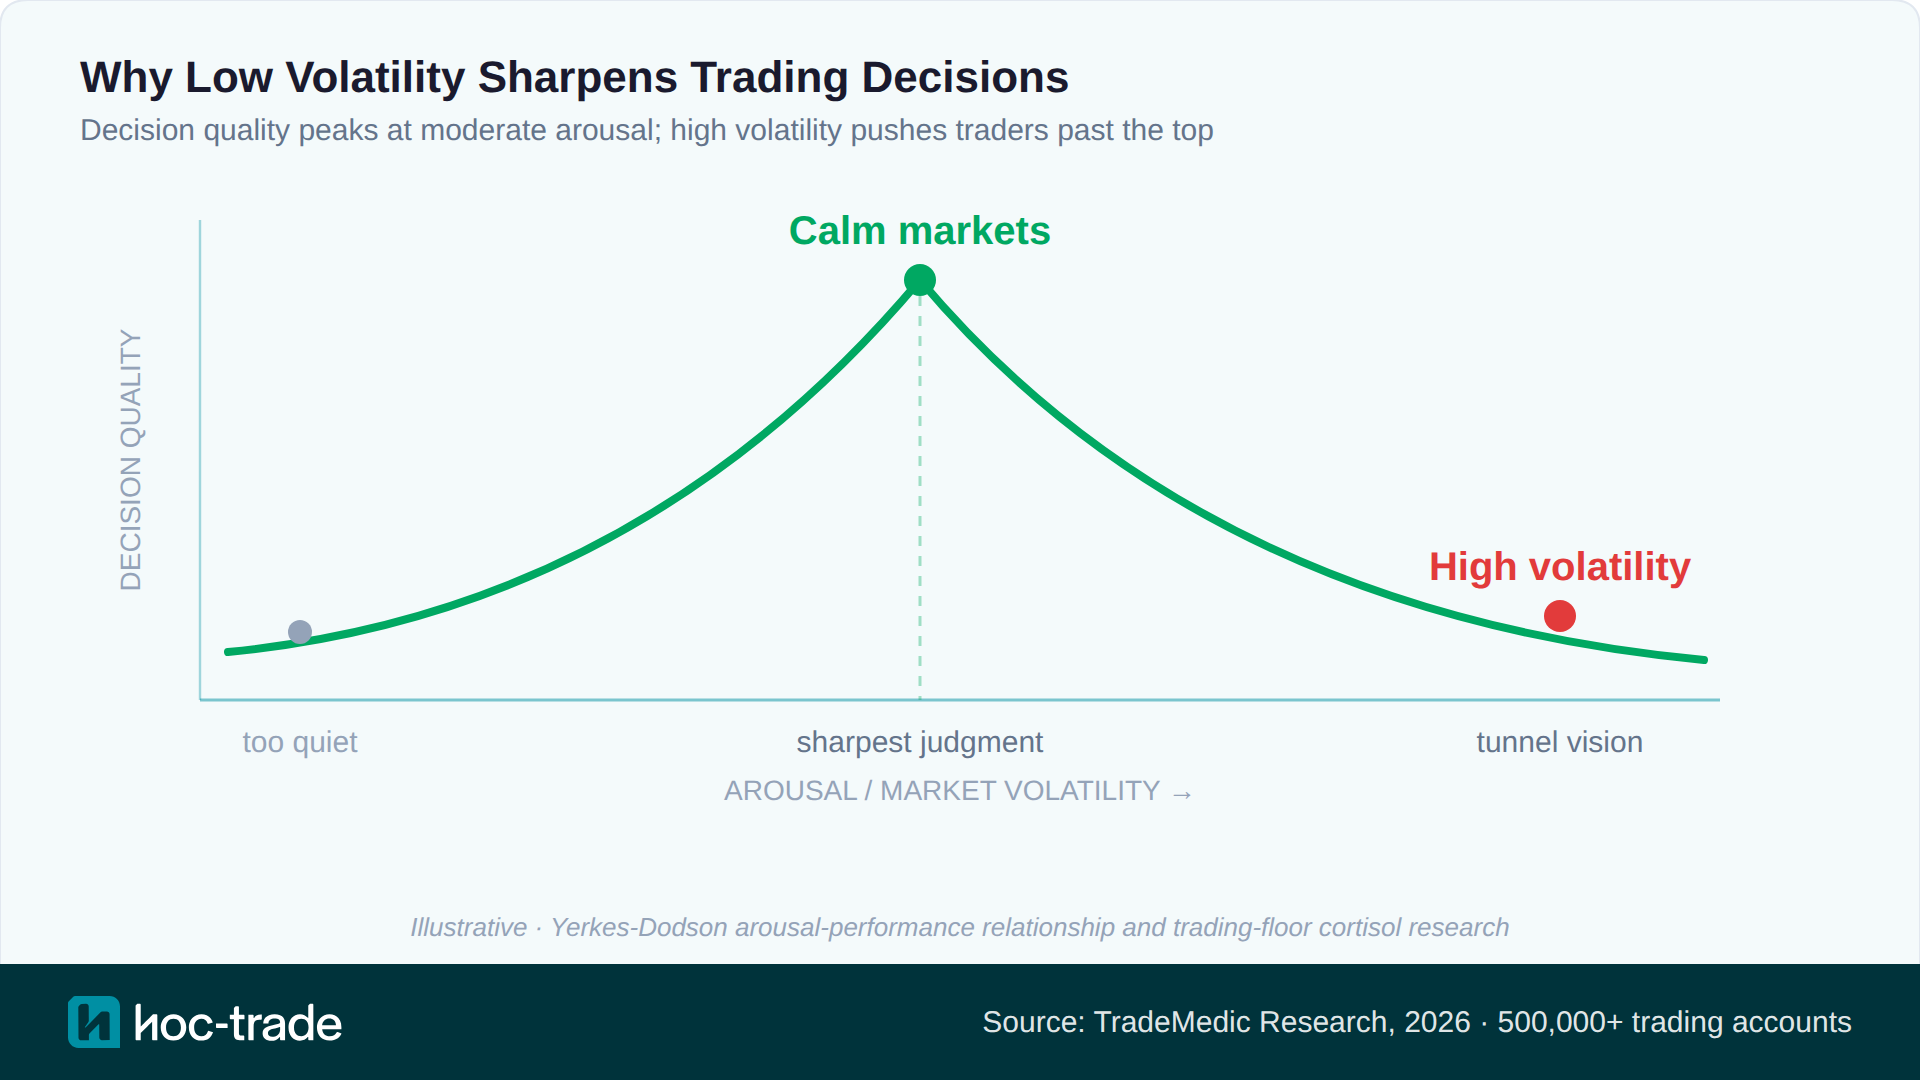
The flip side of all this is what many traders would recognize as boredom trading: when nothing is moving, the urge to do something turns weak setups into apparent opportunities. If you only make money when the market is exciting, the quiet weeks tend to quietly give it back. That is why calm-market performance is best understood as a diagnostic, not a niche skill. It is the baseline that everything else is built on.
How to build low-volatility performance
The usual advice, be patient and wait for your setup, is true but not very useful, because everyone already knows it. What tends to reframe it is treating calm conditions as the proving ground rather than the warm-up. Nobody learns to sail in a storm; you learn on flat water, where your technique is either sound or it is not. The same should apply to trading.
So the honest test is whether you can turn a steady profit when nothing is happening. If you cannot do it in the quiet, more volatility will not fix it; it will only hide the problem for a while and then hand it back. A concrete first step is to pull your own trades apart by the volatility you entered in, and be honest about whether the calm trades made money or whether one or two volatile winners were carrying the whole account. If it is the latter, that is the thing to fix before adding anything else.
Once low-volatility profitability is consistent, you can extend the same disciplined process into busier sessions. The base you build in the quiet is what holds up when conditions get harder. And if you want to practise it deliberately, the naturally quieter sessions, like the Asian session on many pairs, are a reasonable place to do it rather than waiting for the market to hand you a calm stretch.
How TradeMedic detects this in your trading data
Working out whether calm markets are one of your own strengths is hard to do by feel. TradeMedic™ AI does it automatically from your trade history. Every trade is classified by the market volatility at the moment you entered, measured with the Bollinger Bands indicator, and your performance is compared across volatility conditions. If your low-volatility trades consistently outperform and turn an absolute profit, the strength is confirmed and shown in your report. Moreover, the effect is quantified based on your exact trades and your personal trade examples are listed.
It measures the pattern across your whole account rather than any single trade, so it reflects how you really trade, not how you think you trade. You can learn more about TradeMedic at here, or connect your trading account for free to see whether low-volatility performance is already one of your strengths. TradeMedic™ AI also identifies whether you show improvement potential in news trading.
Sources and references
Behavioral pattern data is drawn from TradeMedic Research, 2026, based on an anonymised analysis of more than 500,000 trader accounts. The psychology referenced in this article draws on the following published research:
Grinblatt, M. and Keloharju, M. (2009). Sensation Seeking, Overconfidence, and Trading Activity. The Journal of Finance, 64(2), 549-578.
Yerkes, R. M. and Dodson, J. D. (1908). The relation of strength of stimulus to rapidity of habit-formation. Journal of Comparative Neurology and Psychology, 18, 459-482.
Coates, J. M. and Herbert, J. (2008). Endogenous steroids and financial risk taking on a London trading floor. Proceedings of the National Academy of Sciences, 105(16), 6167-6172.
Mischel, W., Ebbesen, E. B. and Zeiss, A. R. (1972). Cognitive and attentional mechanisms in delay of gratification. Journal of Personality and Social Psychology, 21(2), 204-218.
Frequently asked questions
What is low-volatility trading?
Low-volatility trading means performing well in quiet market conditions, when price ranges are tight, there is little news, and nothing is forcing a move. It rewards consistent, gradual gains and a disciplined process rather than catching one large move.
Is trading in low volatility profitable?
In an analysis of over 500,000 trader accounts, 59% of profitable traders showed strength in low-volatility markets, versus 12% of loss-makers. Among traders without the skill, only about 1 in 10 were profitable, compared with more than half of those who had it. It is a strong marker of profitability, though a correlation rather than proof of cause.
Is low volatility better than high volatility for trading?
The behavioral data suggests low-volatility performance separates profitable traders from loss-makers far more cleanly. The high-volatility skill appears in 31% of profitable traders and 22% of loss-makers, a small gap, while the low-volatility skill shows a 59% versus 12% gap, roughly five times wider.
Does low-volatility trading suit a particular style?
No. The strength is nearly flat across trading styles, appearing in around 25% of swing traders, 20% of day traders, and 19% of scalpers. It reflects process quality rather than timeframe, so it applies to almost every trader.
Why do I lose money in quiet markets?
The most common reason is boredom trading. When nothing is moving, the urge to do something turns weak setups into apparent opportunities, and those marginal trades tend to lose. Quiet markets remove the momentum and news that can rescue a sloppy entry, so a shortfall in patience or selectivity shows up quickly. If you only make money when the market is exciting, the quiet weeks are usually where it gets given back.
What is the best time to trade low-volatility markets?
The naturally quieter sessions are a good place to practise deliberately. For many currency pairs, the Asian session tends to be calmer than the London or New York sessions, with tighter ranges and fewer sharp moves. Rather than waiting for the market to hand you a calm stretch, you can use these predictable quiet windows to test whether your process turns a steady profit when little is happening.
How can I get better at trading low-volatility markets?
Treat calm conditions as a proving ground. Review your own trades split by the volatility you entered in, and check whether the calm trades made money or whether a few volatile winners carried the account. Practising in naturally quiet sessions, such as the Asian session, also helps build the skill deliberately.