Category:
 Author:
 Date:Jul 11, 2026
The 3-5-7 Rule in Trading: Is 3% Risk Per Trade Too High?
If you have spent any time reading about risk management, you have met the 3-5-7 rule. It is one of the most repeated frameworks in retail trading, and for good reason. It is simple, it is easy to remember, and it points a beginner away from the mistakes that end accounts fastest. The rule sets three limits: risk no more than 3% of your capital on a single trade, keep total exposure under 5% across your open positions, and aim for winning trades that are at least 7% larger than your losers, so your wins outweigh your losses over time.
Most of that holds up well against the data. We analysed how much traders risk and what they earn for it across a dataset of more than 500,000 trader accounts, and two of the three numbers match what the evidence favors closely. The one worth a second look is the first one. The accounts that did best in our data were sizing well below the rule's 3% ceiling, often far below. A trader who reads the 3-5-7 rule and settles at a steady 3% per trade is sitting in the group with weaker results, not the strong one.
This is not a case against the rule. The instinct behind it, cap your risk and make your winners count, is exactly right. The refinement is that the 3% figure is more generous than the data supports, and treating it as a target rather than a hard ceiling costs traders more than they realize.
What is the 3-5-7 rule in trading?
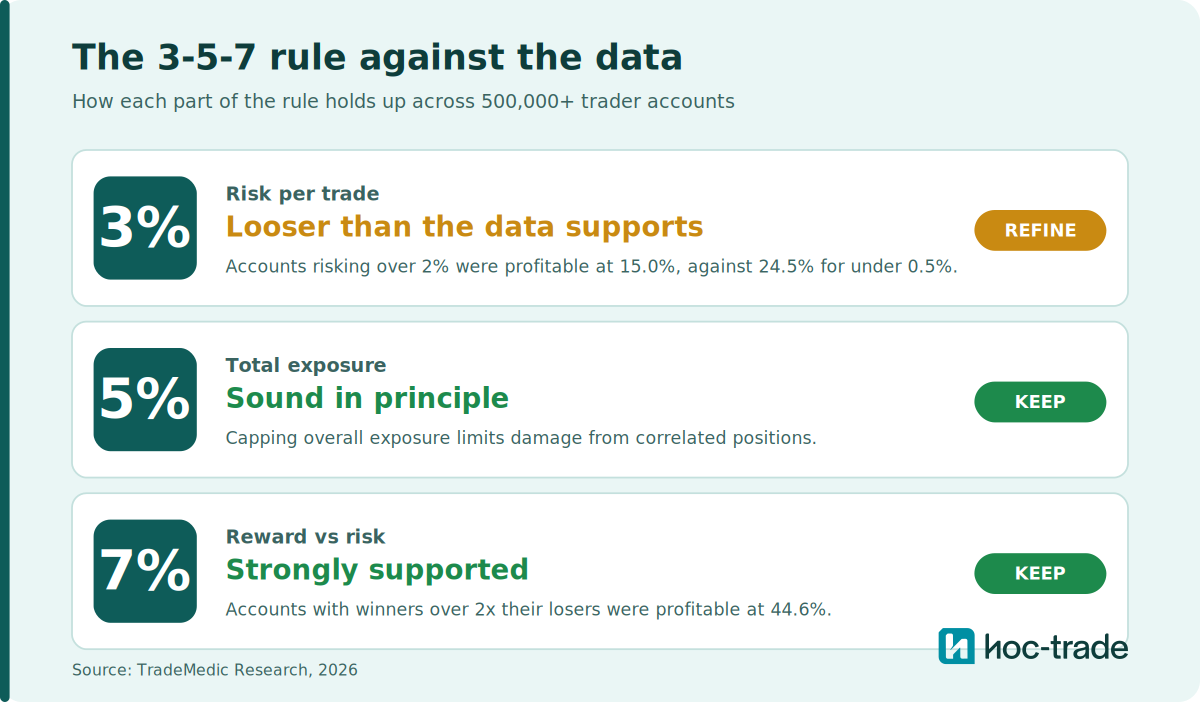
The 3-5-7 rule is a risk management framework built around three percentages. The 3 is the most you should risk on any single trade, set at 3% of your account balance. The 5 is the most you should have exposed across all your open positions at once, capping total portfolio risk at 5%. The 7 is a reward target, the idea that your winning trades should return at least 7% more than your losing trades cost you, so a lower win rate still leaves you profitable.
The appeal is that it turns risk management into three numbers you can hold in your head. It shifts a trader's focus from the question that feels urgent, how much can I make, to the question that keeps accounts alive, how much can I lose and still trade tomorrow. As a starting structure for someone who has never thought about position size, it does real work. Our disagreement is narrow and specific, and it is only with the first number.
Why the 3% risk-per-trade limit is looser than the data supports
Here is the problem with 3%. In our data, we grouped accounts by their average loss on losing trades and checked which groups ended up net profitable. The accounts keeping each losing trade under 0.5% of their balance were profitable at 24.5%. The accounts averaging more than 2% per trade, which is where a 3% risk sits, were profitable at just 15.0%. That is a gap of nearly ten percentage points, and 3% falls on the wrong side of it. You can also read our analysis on the overall profitability of day traders, scalpers, and swing traders.
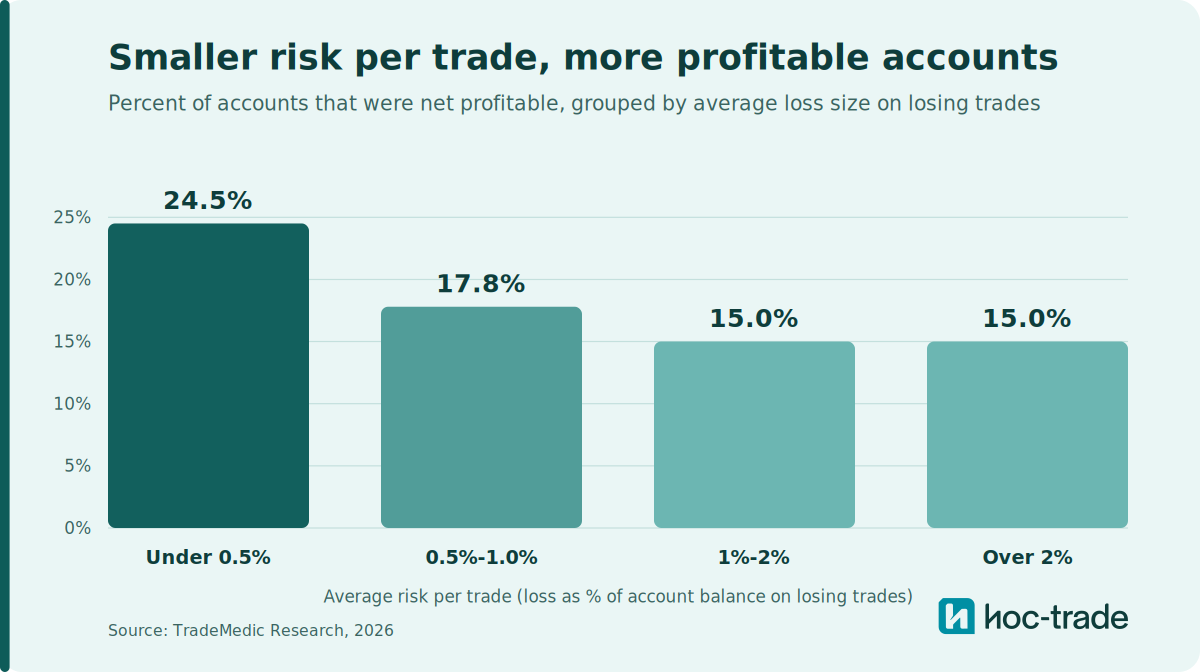
Accounts risking under 0.5% per losing trade were profitable at 24.5%, against 15.0% for the group risking more than 2%, where a 3% risk falls.
The 3% number is not reckless. It will keep a beginner from blowing up on a single trade, which is what it was designed to do. But there is a wide difference between not blowing up and performing well, and the data lives in that gap. The traders with the best results were not sizing at the safe ceiling, they were sizing far under it. So while 3% protects you from catastrophe, it does not put you anywhere near the band where traders are most often profitable. Read the 3 as an upper limit you rarely approach, not a level to settle at.
There is a behavioral reason the smaller size helps, beyond the raw math. A trade that can move your balance by 3% carries emotional weight, and that weight drives the decisions that damage accounts, from moving stops to sizing up after a loss to win it back. Smaller risk per trade lowers the stakes of any single decision, which makes a plan easier to follow. We cover the full pattern in our guide to how much to risk per trade.
A profitable 3-5-7 strategy can still almost guarantee a 50% drawdown
Here is where the 3% becomes concrete. Suppose a trader follows the rule exactly. They risk 3% per trade and target 7%, which is a reward-to-risk ratio of about 2.33. Say they win 33% of the time. That combination is profitable in expectation: winning one in three trades, but when you win you win more than twice of what you lose in a trade comes out positive over the long run, and this trader should grow their account. On paper the strategy works.
The question that matters is not whether the strategy is profitable. It is whether the trader survives the path to those profits. To test this we ran a Monte Carlo simulation, 200,000 simulated traders each taking 1,000 trades with exactly these numbers, and tracked the deepest drawdown each one hit along the way.
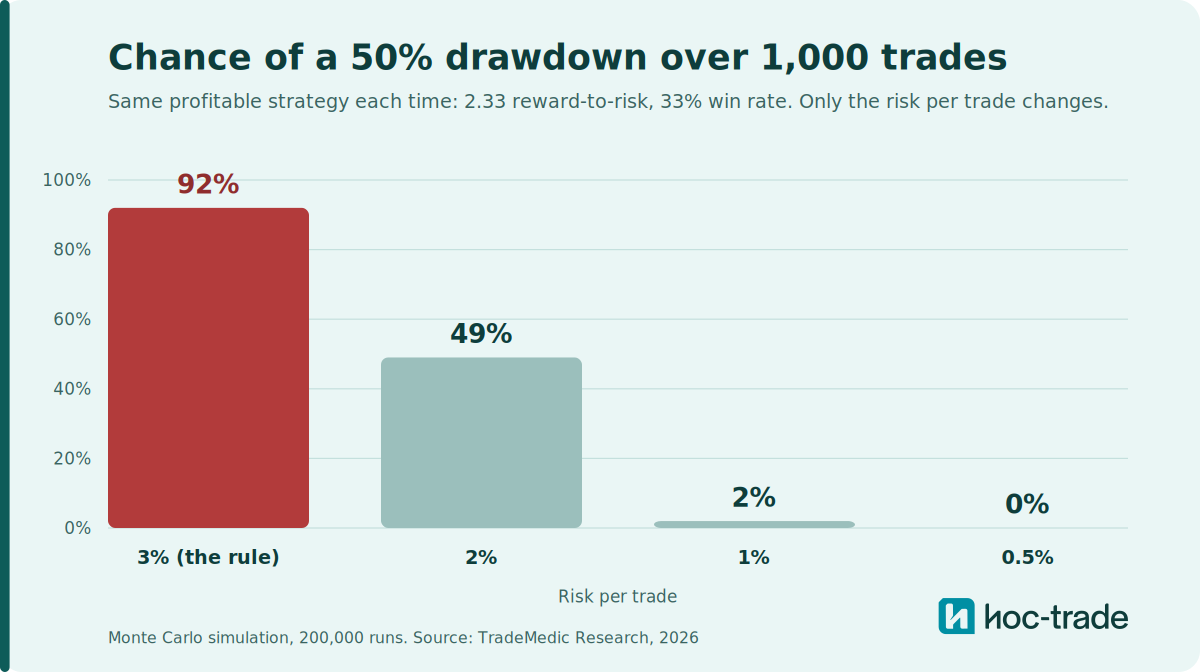
At 3% risk per trade, this profitable strategy had a 92% chance of a 50% drawdown at some point in 1,000 trades. At 1% the same strategy dropped to 2%, and at 0.5% it was effectively zero.
Read that again, because it is the heart of the case against the 3%. The strategy is the same in every bar of the chart. The reward-to-risk ratio, the win rate, the edge, all identical. The only thing that changes is the position size, and it is the position size alone that decides whether the trader is nearly certain to lose half their account along the way or nearly certain to avoid it. At 3% the account is a near-lock to halve at some point. At 1% or below, the same edge sails through.
A 50% drawdown is not a paper problem. Most traders quit before they reach it or completely overrule their own trading principles, so the account never lives to collect the expected profit. A trader on a prop firm or funded account is breached and shut down long before 50%, usually somewhere between 8% and 12%. And a 50% loss requires a 100% gain just to get back to even. So a strategy that looks profitable in a spreadsheet can still end almost every real trader who runs it at 3%, not because the edge is wrong, but because the size is too large to survive the variance the edge comes with. This is the practical failure of the 3% figure. It permits a level of risk that the math shows almost no one lives through.
Why the 5% total exposure limit holds up
The second number, capping total exposure at 5% across open positions, is sound. Our per-trade data does not measure portfolio exposure directly, but the logic is solid: two positions that each look small can add up to a large combined risk, especially in correlated markets where a single move hits both at once. A cap on total exposure is a sensible guardrail, and nothing in the data argues against it.
The 7 is the best part of the rule: why a reward-to-risk ratio above 2 matters
The third number is where the rule is strongest, and it is the part traders most often ignore. The 7 asks for winners that outweigh losers, a positive reward-to-risk skew. This is the single clearest signal of profitability in our data. When we grouped accounts by their reward-to-risk ratio, the realized ratio of average win to average loss, profitability climbed steeply the higher the ratio went.
Accounts whose average winner was less than half their average loser were profitable at just 10.2%. In the balanced band, where wins and losses were roughly equal, the rate rose to 27.3%. And accounts whose winners averaged more than twice their losers were profitable at 44.6%. That is more than four times the rate of the lowest group, driven by the shape of wins and losses rather than how often a trader was right. The reward-to-risk ratio above 2, which is exactly where the 3-5-7 rule's 7% target lands relative to its 3% risk, is where the strongest results cluster.
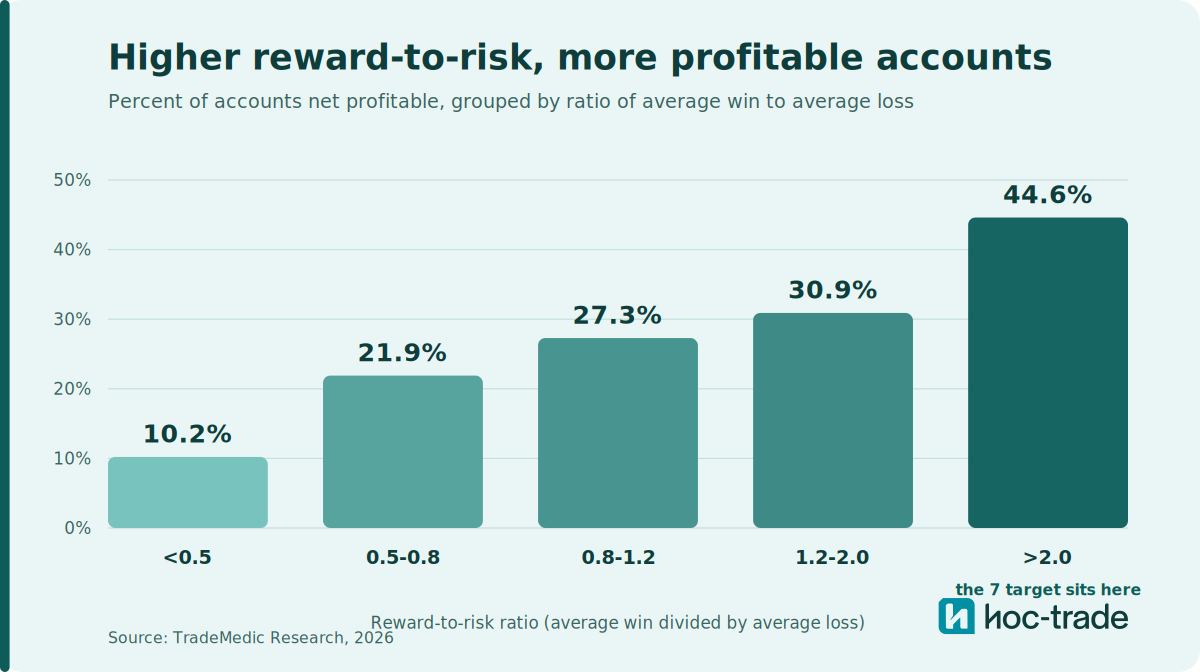
Accounts with a reward-to-risk ratio above 2.0 were profitable at 44.6%, more than four times the 10.2% rate of accounts whose ratio fell below 0.5.
It is worth being precise about why this works, because the point is not that a high ratio is a rule you can apply blindly. A reward-to-risk ratio and a win rate work together, and each strategy has its own balance between them. A lower ratio can still be profitable if the win rate is high enough, and a very high ratio can carry a low win rate. What the data shows is that as the ratio rises, the win rate you need to break even falls, which gives a trader far more room to be wrong and still come out ahead. That is why the accounts with winners more than twice their losers were profitable so much more often. We explore how win rate and reward-to-risk combine to predict profitability in our piece on reward-risk imbalance and win rate, which shows how even a trader who wins most of their trades can lose money when the losses are larger than the wins and how psychology plays a major role in it as well.
If you keep only one number from the 3-5-7 rule, keep the 7. It points traders toward the reward-to-risk zone the data most rewards, and it corrects the instinct that pushes most retail traders in the wrong direction, taking small wins quickly while letting losses run. A trader focused on the 7 is building the exact profile that separates the profitable accounts in our data from the rest.
These two numbers also explain why the framework survives despite the loose 3%. A trader who caps exposure and demands a strong reward skew is doing two of the three things that matter most. Tightening the 3% into something closer to what the data favors is the change that completes the picture.
How to adjust the 3-5-7 rule for what the data shows
The practical fix is small. Keep the structure of the rule, but treat the 3% as a ceiling you stay well under rather than a target. Many of the best-performing accounts in our data were sizing under 0.5% per trade. Somewhere below 1% is a more defensible working figure than 3% for a trader who wants to sit in the stronger group, with 3% reserved as the hard line you never cross.
The other adjustment the rule itself recommends, and the data agrees with, is to let volatility set your stop distance rather than your risk fraction. A calmer instrument can take a tighter stop; a volatile one like gold needs a wider stop to avoid being shaken out. The position size then adjusts to keep the dollar risk fixed at your chosen small fraction. You are not changing how much you are willing to lose, only the lot size that holds that loss steady as conditions change. That keeps risk per trade consistent across everything you trade, which is what the low-risk band in our data does well.
Summary: What does the data say about the 3-5-7 rule?
TradeMedic AI analyzes trading behavior across a dataset of more than 500,000 trader accounts and measures both how much traders risk per trade and how their winners compare to their losers. Against that data, the 3-5-7 rule holds up in two of three parts: capping total exposure is sound, and demanding a reward-to-risk skew is strongly supported, with accounts whose winners exceeded twice their losers profitable at 44.6%. The 3% per-trade limit is the weak point, since accounts risking more than 2% were profitable at 15.0%, against 24.5% for accounts risking under 0.5%.
The takeaway is not to throw the rule out. It gets the direction right, and its emphasis on reward-to-risk is one of the most reliable signals of profitability in the whole dataset. The single change worth making is to stop treating 3% as a place to sit. The traders doing best were nowhere near it. You can see your own average risk per trade, and how your winners compare to your losers, by connecting your account to TradeMedic AI free here. To learn more about the analysis, visit TradeMedic™.
Source: TradeMedic Research, 2026.
Frequently asked questions
What is the 3-5-7 rule in trading?
The 3-5-7 rule is a risk management framework with three limits: risk no more than 3% of your account on a single trade, keep total exposure under 5% across all open positions, and aim for winning trades that return at least 7% more than your losers cost, so your wins outweigh your losses over time.
Is the 3-5-7 rule in trading good?
Mostly. Two of its three numbers hold up well against data from more than 500,000 accounts: capping total exposure is sound, and demanding winners larger than losers is strongly supported, with accounts whose winners exceeded twice their losers profitable at 44.6%. The weak point is the 3% risk-per-trade limit, which is looser than the data favors.
Is 3% risk per trade too high?
The data suggests it is looser than optimal. Accounts risking more than 2% per trade, where a 3% risk sits, were profitable at 15.0%, against 24.5% for accounts risking under 0.5%. The 3% figure protects a beginner from blowing up, but the best-performing traders sized well below it. Treat 3% as a ceiling you rarely approach rather than a target.
Is a reward-to-risk ratio above 2 good?
The data supports it strongly. Accounts whose average winner was more than twice their average loser were profitable at 44.6%, against 10.2% for accounts whose reward was less than half their risk. A higher reward-to-risk ratio lowers the win rate you need to break even, giving more room to be wrong and still profit. It works alongside win rate rather than on its own, but above 2 is where the strongest results cluster, and it is where the 3-5-7 rule's 7% target lands.
Which part of the 3-5-7 rule in trading matters most?
The 7, the reward-to-risk part. In a dataset of more than 500,000 accounts, those whose winners averaged more than twice their losers were profitable at 44.6%, against 10.2% for accounts whose reward was less than half their risk. That is more than four times the rate, making a strong reward-to-risk skew one of the clearest signals of profitability.
How should you adjust the 3-5-7 rule in trading?
Keep the structure but treat the 3% as a hard ceiling you stay well under rather than a target. A working figure below 1% per trade sits closer to the band where traders were most often profitable. Let the instrument's volatility set your stop distance, and let the position size adjust to hold your chosen small risk fraction steady.
Can a profitable trading strategy still blow up?
Yes. A strategy can be profitable in expectation and still ruin most traders who run it, because expectancy and survival are different questions. In a simulation of a profitable 3-5-7 strategy (2.33 reward-to-risk, 33% win rate), risking 3% per trade produced a 92% chance of a 50% drawdown over 1,000 trades. The edge was positive, but the position size made a ruinous drawdown nearly certain.
What is the risk of a 50% drawdown at 3% risk per trade with 33% win rate?
In a Monte Carlo simulation of 200,000 traders each taking 1,000 trades with a profitable 2.33 reward-to-risk strategy at a 33% win rate, risking 3% per trade gave a 92% chance of hitting a 50% peak-to-trough drawdown. The same strategy at 1% risk fell to 2%, and at 0.5% to effectively zero. Position size alone drove the difference.