Category:
 Author:
 Date:Jul 11, 2026
How Much Should You Risk Per Trade? What 500,000+ Accounts Reveal About Risk Per Trade
Every new trader hits the same question within their first week. You open the position size box, you have a number in mind for the trade, and then you pause. Is this too much? The account is real money. One bad run and it is gone. So you guess, or you copy a rule you read somewhere, and you move on. The trade works or it does not, and you never really learn whether the size was right.
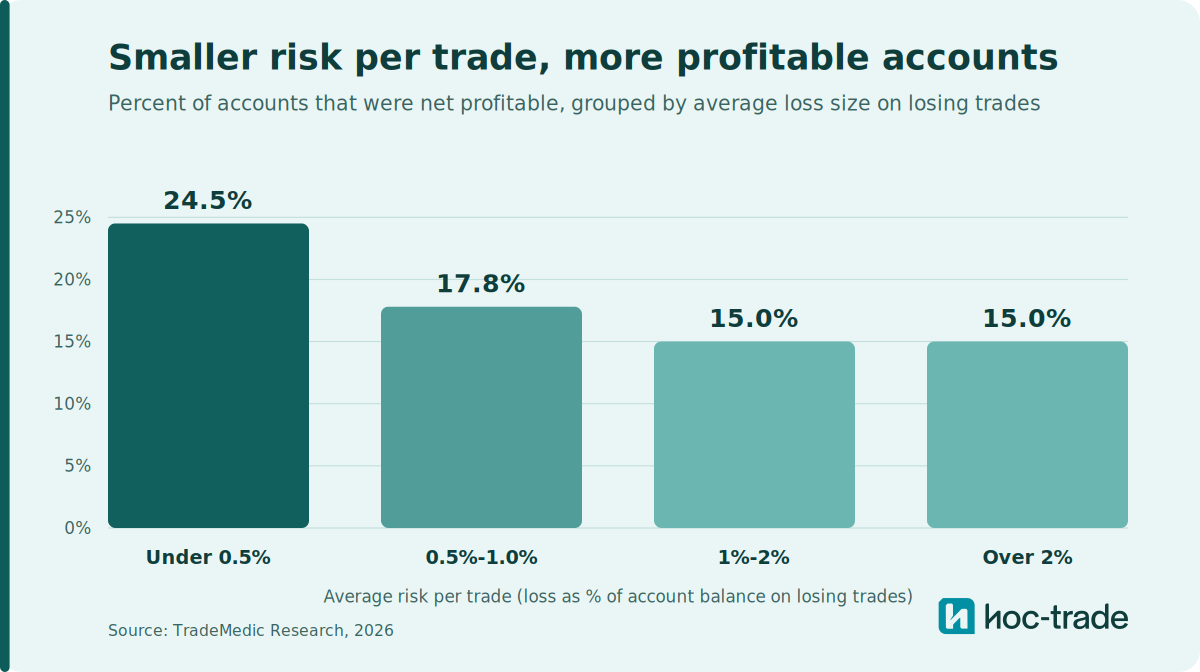
We looked at how much traders really risk per trade across a dataset of more than 500,000 trader accounts, and then checked which groups ended up net profitable. Grouping accounts by their average loss on losing trades, the accounts that kept each losing trade under 0.5% of their balance were profitable at a rate of 24.5%, against 15.0% for accounts averaging more than 2% per losing trade. That is a large gap. The pattern is clean: profitability is highest in the smallest risk band and settles lower as risk climbs, and the under-0.5% group stands clearly apart from everyone else.
This runs against the most repeated piece of advice in retail trading. The common rule says risk 1% or 2% per trade. In the data, the accounts risking 1% to 2% were profitable at 15.0%, the same rate as the whole group risking above 2%, and both trailed the under-0.5% band by nearly ten percentage points. The traders doing best were sizing well below the number most advice points them toward.
How much should you risk per trade?
The short answer from the data: less than most traders think. Across the accounts we analysed, the group risking under 0.5% of their balance on a typical losing trade had the highest share of profitable accounts at 24.5%. Each step up in risk was associated with a lower share, dropping to 17.8% in the 0.5% to 1% band, then to 15.0% for both the 1% to 2% band and the whole group risking more than 2%. The clearest line in the data is not a smooth slope, it is a separation: the under-0.5% band sits well above everything else.
It helps to be precise about what this number is. We are measuring the realized average loss on losing trades as a percent of account balance. That is a proxy for how much a trader intends to risk, not a reading of the stop-loss they typed in. A trader who sets a 1% stop but closes early, or who lets a loser run past the stop, will show up differently from the number they planned. So read these bands as how much traders were in fact losing per losing trade, which is the figure that matters for the account.
A second point matters just as much. This is a correlation across a large population, not proof that shrinking your risk turns you profitable on its own. The accounts in the lowest risk band almost certainly do other things well too, and tight risk sizing tends to go with patience, planning, and a willingness to sit out. What the data supports is a clear statement: traders who kept risk per trade small were far more likely to be in the profitable group. It does not support the claim that cutting size is a switch you flip.
Are the 1% and 2% risk rules good advice?
The 1% rule and the 2% rule exist for a good reason. They protect a beginner from the single fastest way to blow an account, which is betting too much on one idea. If you are choosing between risking 10% per trade and risking 2%, the 2% rule is doing real work. It buys you enough trades to survive a losing streak, and survival is the whole game early on.
Where the rules mislead is in framing 1% or 2% as the target rather than the ceiling. In our data, the accounts sitting in the 1% to 2% band were profitable at 15.0%, the same rate as the whole group risking above 2%. The band below them, under 0.5%, beat both by nearly ten percentage points. So a trader who reads the 2% rule and lands at a steady 2% per trade is sizing right in the group with the weaker results. The rule is a guardrail, not a recommendation to use the whole allowance.
There is a psychological cost to larger risk that the numbers hint at. When a single trade can move your balance by 2% or more, each position carries emotional weight. That weight is what drives the behaviors that damage accounts: moving stops, doubling down, cutting profits early because you do not want the trade to go back in loss, or sizing up during a loss streak.
The same caution applies to the 3-5-7 rule, a popular framework that caps risk at 3% per trade, keeps total exposure under 5%, and asks for winners at least 7% larger than losers. Two of those three numbers line up with what our data shows: limiting total exposure is sound, and demanding a strong reward-to-risk skew is one of the clearest signals of profitability in the dataset. The 3% per-trade figure is the loose one. A trader sitting at 3% is in the over-2% band that was profitable at just 15.0%, well below the 24.5% of the under-0.5% group. We look at this in detail in our piece on whether the 3-5-7 rule holds up against the data.
Why big daily swings, up or down, make risk per trade worse
Risk per trade does not live in isolation. It compounds through the day, and the size of your daily swing feeds back into how well you trade next. In our dataset, the single most common improvement area, affecting more than 70% of all traders, is the failure to stop trading after a big day. It shows up on both sides. After a large daily loss, traders push to win it back. After a large daily gain, they treat the profit as house money and size up, loosening the discipline that produced the gain in the first place. In both cases the trades that follow tend to perform worse.
Larger risk per trade makes this trap easier to fall into, because it produces the big up and down days that set it off. A trader risking 0.5% rarely has a single session swing large enough to trigger the house-money urge or the need to recover. A trader risking 3% can build a painful loss or an exciting gain inside a just a few of trades, and then carries that emotional state into the next decision. The push to win back a loss with a bigger position is its own documented pattern, one we cover in our piece on revenge trading. Small, steady risk per trade keeps daily swings contained, which is part of why the low-risk band holds together.
How much should you risk per trade in forex?
The pattern in the data is not specific to one instrument, and the same logic applies to forex position sizing. What matters is the risk band, not the pair. A forex trader whose average losing trade costs 3% of the account is in the over-2% group regardless of whether they trade EUR/USD or a cross. So the goal is the same as anywhere else: size each position so that hitting your stop costs a small, fixed fraction of the account.
What changes between instruments is the stop distance, not the risk fraction. Your stop belongs where your trading setup says the idea is wrong, and that distance depends on how much the instrument moves. A major forex pair is often less volatile than something like gold, so a valid stop on that pair can sit tighter, while the same setup on gold needs a wider stop to avoid being shaken out by normal swings. The position size then adjusts to keep the dollar risk constant: a tighter stop allows a larger position for the same risk, and a wider stop calls for a smaller one. You are not changing how much you are willing to lose, only the lot size that keeps that loss fixed as the stop distance changes.
This is the core of forex risk management, and it is the step most retail traders skip. They choose a position size by habit, apply the same lot size to a calm pair and a volatile one, and discover the risk only after the fact. Deriving the position from your setup and the instrument's volatility is what keeps the risk per trade steady across everything you trade.
How do you calculate risk per trade?
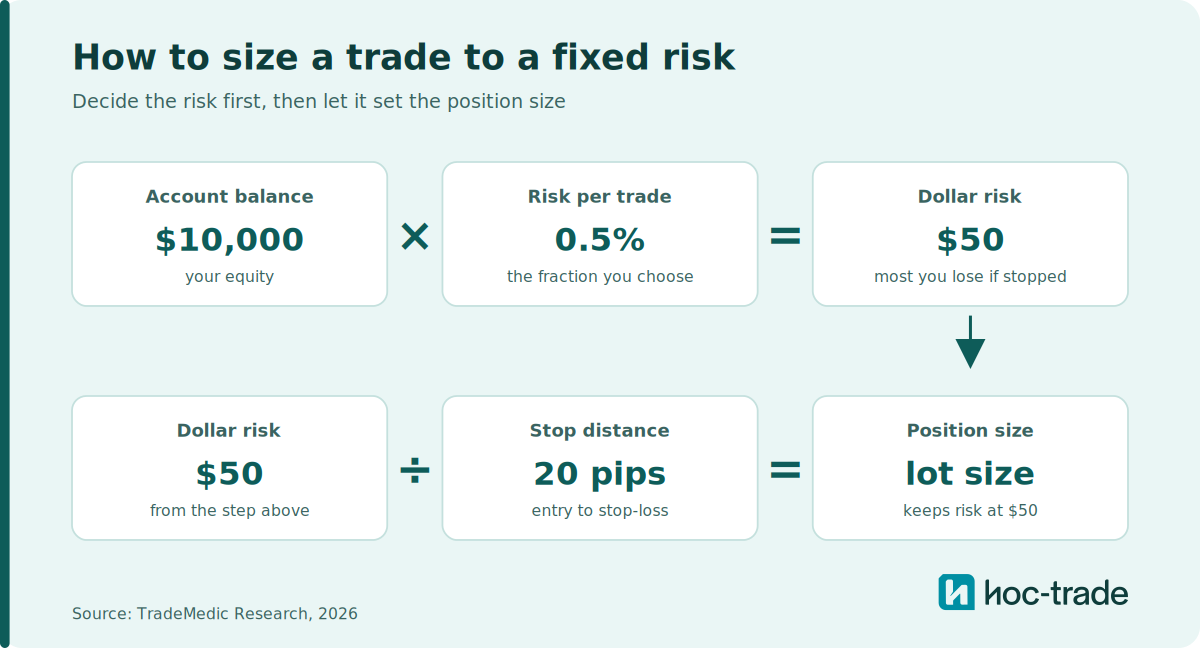
Risk per trade is the distance from your entry to your stop, multiplied by your position size, expressed as a percent of your account balance. To size a trade to a fixed risk, you work backwards. Start with the percent of the account you are willing to lose on the trade. Multiply your balance by that percent to get the dollar risk. Divide that dollar risk by the distance from entry to stop, and you have the position size that keeps the loss at your chosen fraction if the stop is hit.
The reason this order matters is that it forces the risk decision to come first. When you set the position size by feel and add a stop afterward, the risk is whatever falls out, and it drifts larger over time, especially after a win when confidence is high. Deciding the fraction first and letting it drive the size is what keeps a trader in the low-risk band that the data favors. It also removes the in-the-moment judgment call that tends to go wrong under pressure and challenges you to cross-check whether you maybe set your stop loss too wide (you can increase the position size with a narrow stop while keeping the absolute risk flat).
Risk per trade, risk-reward, and win rate: how they fit together
Risk per trade sets the size of your loss. What you do with the other side, the size of your wins relative to those losses, matters just as much. Two numbers describe that trade-off. Your hit rate is how often you win. Your risk-reward ratio is how much you make on a winning trade compared with what you lose on a losing one. Traders fixate on win rate because winning feels good, but the data says the second number carries more weight.
Across the accounts we analysed, profitability climbed steeply with risk-reward. Accounts whose average reward was less than half their average risk were profitable at just 10.2%, rising through 27.3% in the balanced band, to 44.6% for accounts whose winners averaged more than twice their losers. Hit rate mattered too, from 4.8% profitable below a 20% win rate up to 31.6% above 80%, but even a high win rate could not save an account whose losses dwarfed its wins.
This connects directly to risk per trade. Keeping risk small on each trade is what makes a healthy risk-reward ratio reachable, because it lets you give a winning trade room to run without a single loss (or multiple) doing serious damage. A trader risking heavily is under pressure to grab small profits and cut winners short, which pushes the risk-reward ratio down toward the band where almost no one is profitable. A trader can win often and still lose money when the losers are large, a trap we cover in our piece on reward-risk and win rate.
Why risk per trade is the foundation of risk management in trading
Risk per trade is one input, but it sets the ceiling on everything else. Your maximum drawdown, how many losses in a row you can take, and how much room you have to be wrong while you learn or have bad luck all trace back to how much you put behind each trade. A trader risking 0.5% can lose ten trades in a row and still be down only about 5% (even slightly less if re-calibrating after every trade). A trader risking 3% is down roughly 30% over the same streak, which is a hole most accounts never climb out of.
This is why risk management in trading starts with position size rather than with entries. Traders spend most of their attention on where to get in, which is the part with the least leverage over long-run results. The size of the trade, applied consistently, does more to determine whether an account survives long enough to get good. The accounts in our lowest risk band gave themselves the most room to make mistakes and keep trading, and that room shows up in the profitability numbers. And even if your entries are not perfect, this does not really influence the likelihood of you being profitable as shown in a dedicated analysis about impatient entries..
Summary: What does the data say about risk per trade?
TradeMedic AI analyzes trading behavior across a dataset of more than 500,000 trader accounts and calculates each trader's personal risk profile, including how much they risk per trade and how consistently they size positions. In this dataset, accounts that kept average risk per trade under 0.5% of their balance were profitable at 24.5%, compared with 15.0% for accounts averaging more than 2%. Position sizing sits among the behaviors most closely tied to whether an account ends up in the profitable group.
The number most traders should take from this is smaller than the one they are using. If the common advice put you at 1% or 2% per trade, the data suggests the traders doing best were sizing below that, often well below. Start by finding out what you are truly risking per trade, since the realized number is often larger than the intended one, then bring it down and hold it steady. The point is not to trade scared. It is to make any single trade small enough that following your plan is easy.
You can see your own average risk per trade, along with how consistent your position sizing is, by connecting your trading account to TradeMedic AI free here. To learn more about how the behavioral analysis works, visit TradeMedic™.
Source: TradeMedic Research, 2026.
Frequently asked questions
How much should you risk per trade?
Across an analysis of more than 500,000 trader accounts, the accounts risking under 0.5% of their balance on a typical losing trade had the highest share of profitable accounts at 24.5%, well above the 15.0% rate of accounts risking more than 2%. Smaller average risk per trade was associated with a higher likelihood of profitability, and the under-0.5% group stood clearly apart from the rest. This is a correlation across a large population rather than a guarantee that cutting risk makes any single trader profitable.
Is the 1% or 2% risk per trade rule good advice?
The 1% and 2% rules are useful guardrails because they prevent the fastest way to blow an account, which is risking too much on one trade. In the data, though, accounts risking under 0.5% per trade were profitable at 24.5%, while the 1% to 2% band and the whole group risking above 2% both sat at 15.0%. The rules work best as a ceiling rather than a target to fill.
How do you calculate risk per trade?
Multiply your account balance by the percent you are willing to lose to get your dollar risk, then divide that by the distance from your entry to your stop to get the position size. For example, $10,000 at 0.5% risk is a $50 dollar risk, and a 20 pip stop sets the lot size that keeps the loss at $50. Deciding the risk fraction first and letting it set the position size keeps risk consistent.
How much should you risk per trade in forex?
The same principle applies to forex: size positions so that hitting your stop costs a small, fixed fraction of the account. In the data, what matters is the risk band, not the currency pair. A forex trader whose average losing trade costs 3% of the account is sizing in the group with weaker results, which trailed the under-0.5% band that was profitable at 24.5%.
Does risking more per trade lower your chances of being profitable?
In a dataset of more than 500,000 accounts, the share of profitable accounts was highest for the smallest risk band and lower for every larger one: 24.5% under 0.5%, 17.8% at 0.5% to 1%, and 15.0% for both the 1% to 2% band and the whole group risking more than 2%. The under-0.5% group separated clearly from the rest rather than sitting on a gentle slope.
Is risk-reward or hit rate more important?
Both matter, but the data gives more weight to risk-reward. Accounts whose winners averaged more than twice their losers were profitable at 44.6%, against 10.2% for accounts whose reward was less than half their risk. Hit rate ran from 4.8% profitable below a 20% win rate to 31.6% above 80%, but a high win rate did not rescue accounts whose losses were much larger than their wins. Small risk per trade is what makes a strong risk-reward ratio reachable.
Should you stop trading after a big win or a big loss?
The data suggests yes. The most common improvement area in a dataset of more than 500,000 accounts, affecting over 70% of traders, is the failure to stop after a large day, and it hurts on both sides. Traders push to recover after a big loss and treat profit as house money after a big gain, and the trades that follow tend to perform worse. Keeping risk per trade small helps by keeping daily swings contained in the first place.