Risk-Reward Ratio vs Win Rate: Which Matters More?

Most of what you read about risk-reward ratio versus win rate is built on the same made-up examples. A trader wins 40% of the time at a 3:1 ratio, another wins 70% at 1:1, and the math says the first one comes out ahead. It is a clean illustration, and it is repeated across almost every article on the subject. What it is missing is data. Nobody checks whether real traders behave the way the example assumes, or which of the two metrics separates the profitable traders from everyone else once you look at hundreds of thousands of live accounts.
We can answer that. We analyzed our TradeMedic dataset of 500,000+ trading accounts, grouping traders by their risk-reward ratio and by their win rate, and measuring one thing for each group: what share of those traders ended up net profitable. The result settles the question with numbers instead of a worked example, and it surfaces something the hypotheticals never capture, which is that the typical trader is making the exact mistake the math warns against.
What is a risk-reward ratio?
A risk-reward ratio, often shortened to RRR, measures how big your average win is compared to your average loss. Divide your average winning trade by your average losing trade. If your typical winner is $300 and your typical loser is $150, your risk-reward ratio is 2.0. A ratio above 1.0 means your winners are larger than your losers on average. Below 1.0 means your losers are larger than your winners.
Win rate is a different measure entirely. It is simply how often you win. If 45 of your last 100 trades closed in profit, your win rate is 45%. It says nothing about the size of those wins or losses.
These two numbers describe completely different things, and a trader can score well on one while scoring badly on the other. You can win often and still lose money if your losses are large. You can win rarely and still make money if your wins are large. The whole question is which one matters more for whether you end up profitable, and that is what the data can answer.
Risk-reward ratio vs win rate: which matters more?
Both matter. But across 500,000+ accounts, risk-reward ratio has the larger effect on whether a trader is net profitable.
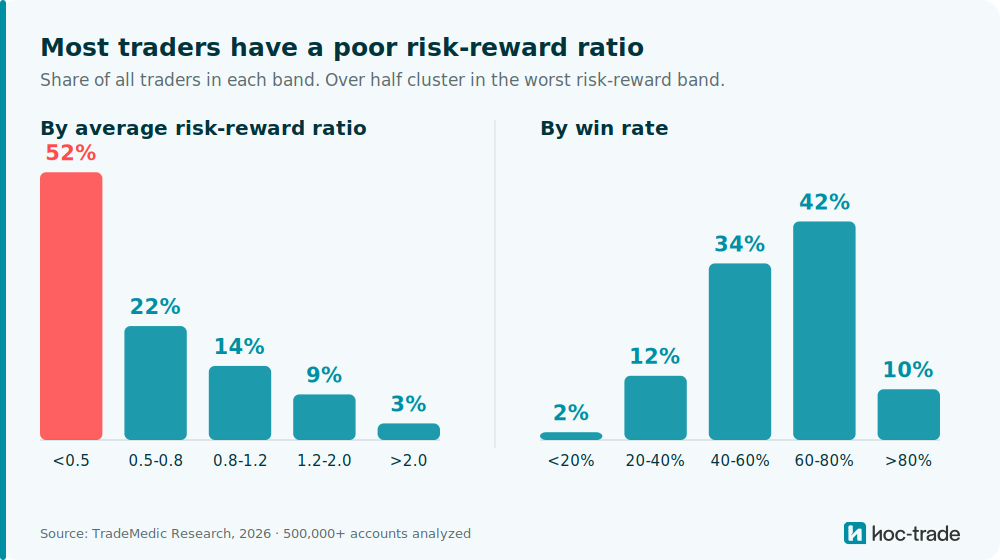
When we grouped traders by their risk-reward ratio, the share who were net profitable climbed steadily as the ratio improved. In the lowest band, where average losses are more than double average wins, only 10.2% of traders were profitable. In the highest band, above 2.0, that figure reached 44.6%, more than four times higher.
Risk-reward ratio | Traders | Net profitable |
Below 0.5 | 161,609 | 10.2% |
0.5 to 0.8 | 68,935 | 21.9% |
0.8 to 1.2 | 44,638 | 27.3% |
1.2 to 2.0 | 27,494 | 30.9% |
Above 2.0 | 10,009 | 44.6% |
Figures cover accounts with at least 50 trades, the threshold below which results are not statistically reliable, drawn from our dataset of 500,000+ analyzed accounts.
Moving from the worst risk-reward band to the best lifts the profitable share from 10.2% to 44.6%, a spread of 34.4 percentage points. Win rate matters too, and it follows the same upward direction. Traders who win more often are more likely to be profitable. But the spread is narrower.
Win rate | Traders | Net profitable |
Below 20% | 4,706 | 4.8% |
20% to 40% | 39,009 | 8.2% |
40% to 60% | 106,723 | 14.0% |
60% to 80% | 132,319 | 21.9% |
Above 80% | 30,556 | 31.6% |
Figures cover accounts with at least 50 trades, drawn from our dataset of 500,000+ analyzed accounts.
Across the win-rate bands, the profitable share moves from 4.8% to 31.6%, a spread of 26.8 percentage points. Wide, but narrower than the 34.4-point spread on risk-reward. Where a trader sits on the risk-reward scale separates the profitable from the unprofitable more sharply than where they sit on the win-rate scale.
One detail matters before reading too much into this. These are correlations across a large population, not a recipe. A trader in the top risk-reward band is profitable 44.6% of the time, which is far better than the 10.2% at the bottom, but it is still not a majority. A strong risk-reward ratio improves the odds substantially. It does not guarantee an outcome.
What most traders get wrong
The data exposes a clear and costly mistake. Most traders chase the win rate and neglect the risk-reward ratio, which is the opposite of what the numbers reward.
More than half of all traders, 51.7%, sit in the worst risk-reward band, below 0.5. On average, that group is taking losses larger than twice their wins. At the same time, the largest clusters of traders sit in the high win-rate bands: 42.2% in the 60 to 80% band and 34.1% in the 40 to 60% band. Put those two facts together and a clear pattern emerges. The typical trader wins often and loses big.
They are optimizing for the metric that feels good, the frequency of being right, while ignoring the metric that drives profitability, the size of the wins against the losses. This specific pattern, where average losses outweigh average wins, is what we call a reward-risk imbalance, and it is one of the most common risks in the dataset. The 10.2% profitability rate in that worst risk-reward band is the cost of that choice, and it is paid by the largest single group of traders in the dataset.
This is usually framed as a discipline problem, and discipline is part of it, because many trades start out with a much better RRR in theory (in their trade set-up), but the actual results differ due to decisions made along the way of a trade. Cutting winners short to lock in the feeling of a win, and holding or doubling down in losers in the hope they turn around, are choices a trader makes in the moment. But there is more going on than willpower. Closing a winning trade delivers an immediate, certain reward, and the human brain is wired to prefer certain rewards now over larger uncertain rewards later. Holding a losing trade avoids the sharp discomfort of booking a loss, and loss aversion research shows that the pain of a loss registers more strongly than the pleasure of an equivalent gain. The behavior that erodes risk-reward is not laziness. It is the path of least emotional resistance, and almost everyone feels the pull.
What is a good risk-reward ratio?
The common guidance is to aim for a ratio of at least 2.0, meaning your average winner is twice your average loser. The data supports the direction of that advice. Traders above a 2.0 ratio were net profitable at 44.6%, the highest of any band, and the profitable share rose at every step up the scale.
A ratio that high is not realistic for every strategy, and it does not need to be. The data shows meaningful improvement well before 2.0. Traders in the 0.8 to 1.2 band were profitable at 27.3%, nearly triple the 10.2% rate of the worst band. Simply getting your average winner up to roughly the size of your average loser, rather than letting losses run larger, moves you out of the group where most traders fail. The target is not perfection. It is making sure your winners are not systematically smaller than your losers, which is exactly the trap that more than half the population falls into. The point here is not to force a specific RRR in trades, as strategies and set-ups of course differ significantly, but to give general guidance on where profitability appears to cluster most. Clearly there are strategies with low RRR of <0.5 that are still profitable overall (10% of them in the dataset).
What is the break-even win rate for each risk-reward ratio?
There is a fixed mathematical link between the two metrics, and it explains why risk-reward is worth managing. For any risk-reward ratio there is a minimum win rate you need just to break even. The formula is simple: break-even win rate equals one divided by one plus the ratio.
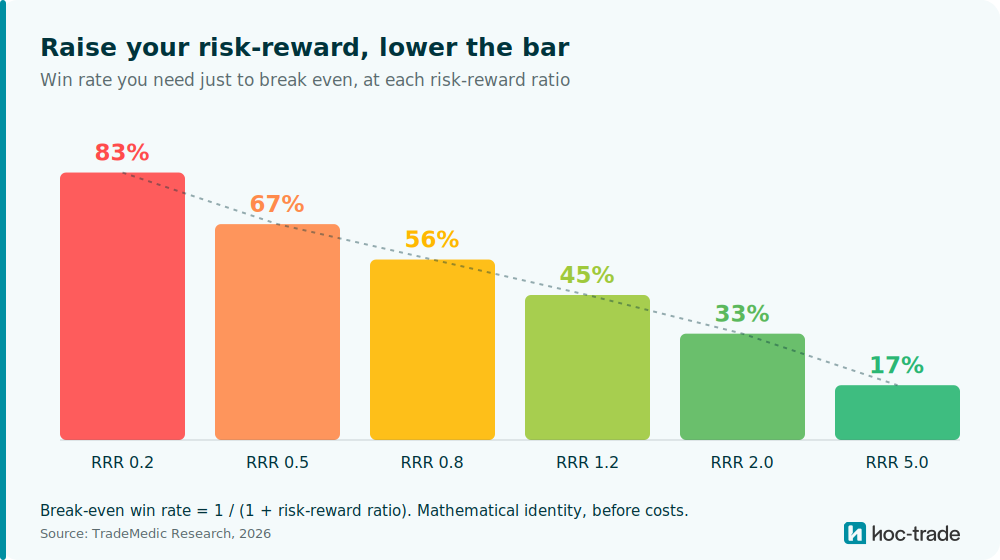
The numbers are very clear. At a risk-reward ratio of 0.2, where losses are five times the size of wins, a trader needs to win 83% of the time just to break even, a rate almost nobody sustains. At 0.5 the break-even win rate is 67%. At 1.2 it drops to 45%, well within reach. At 2.0 it falls to 33%, and at 5.0 to 17%. Raising your risk-reward ratio does not only improve your odds directly. It lowers the win rate you need to clear.
This is also why risk-reward is the metric worth focusing on first. It is the one you directly control. You set the stop and the target before the trade, and you decide whether to honor them once it is live. Win rate is largely an outcome of those choices meeting the market. You cannot simply decide to win more often, but you can decide, on every trade, how much you stand to lose against how much you stand to gain. Pulling a stop further away to avoid being closed out, or cutting a target short to lock in a smaller win, both push the ratio down in the moment. They feel like prudence. Over a few hundred trades, they are the difference between the worst band and a workable one.
How TradeMedic measures your risk-reward behavior
The figures above describe a population. The more useful question is where your own account sits, and that is what TradeMedic is built to answer. It ingests your real trade history and analyzes the behavior behind your risk-reward ratio in the context of the conditions you traded in: the volatility, the session, the instrument, and the state you were in when you closed each trade.
Rather than a single ratio, it identifies the specific moments that pull your risk-reward down. It detects when you close winners early and quantifies what that habit costs you across your history in real dollars. It flags when losses are allowed to run past where your own plan would have exited. It separates the trades where your timing helped from the ones where it hurt. The output is not generic advice to improve your risk-reward. It is a quantified picture of which behaviors are widening the gap between your wins and your losses, ranked by how much each one is costing you.
Learn more about how TradeMedic™ AI analyzes your trading or connect your account free to see where your own risk-reward ratio sits.
The bottom line
Across 500,000+ verified accounts, roughly 1 in 5 traders were net profitable. Both win rate and risk-reward ratio separate the profitable from the rest, but risk-reward separates them more sharply, with a 34.4-point spread from worst to best band against 26.8 points for win rate. The clearest finding is behavioral: more than half of all traders sit in the worst risk-reward band while clustering in high win-rate groups, which is the precise combination, winning often and losing big, that the math has always warned against. The traders who break that pattern, by protecting the size of their winners relative to their losers, are profitable at several times the rate of those who do not. And because risk-reward is the metric a trader most directly controls, it is the most actionable place to start.
Source: TradeMedic™ Research, 2026. Drawn from our dataset of 500,000+ analyzed trading accounts; analysis is based on accounts with a minimum of 50 trades each. Profitability is measured at the MT account level. Figures describe correlations across the population and are not a guarantee of individual results.

