Category:
 Author:
 Date:Jul 20, 2026
How Many Pairs Should You Trade? The Data Says It Barely Matters, Except at One Extreme
Ask ten traders how many pairs to trade and you'll get ten confident answers. One camp swears the only path is mastering a single market. The other insists you're leaving setups on the table if you watch fewer than five. Influencers and educators mostly argue for 1-3 markets. The debate runs through every trading forum and Discord server, and it almost never comes with data.
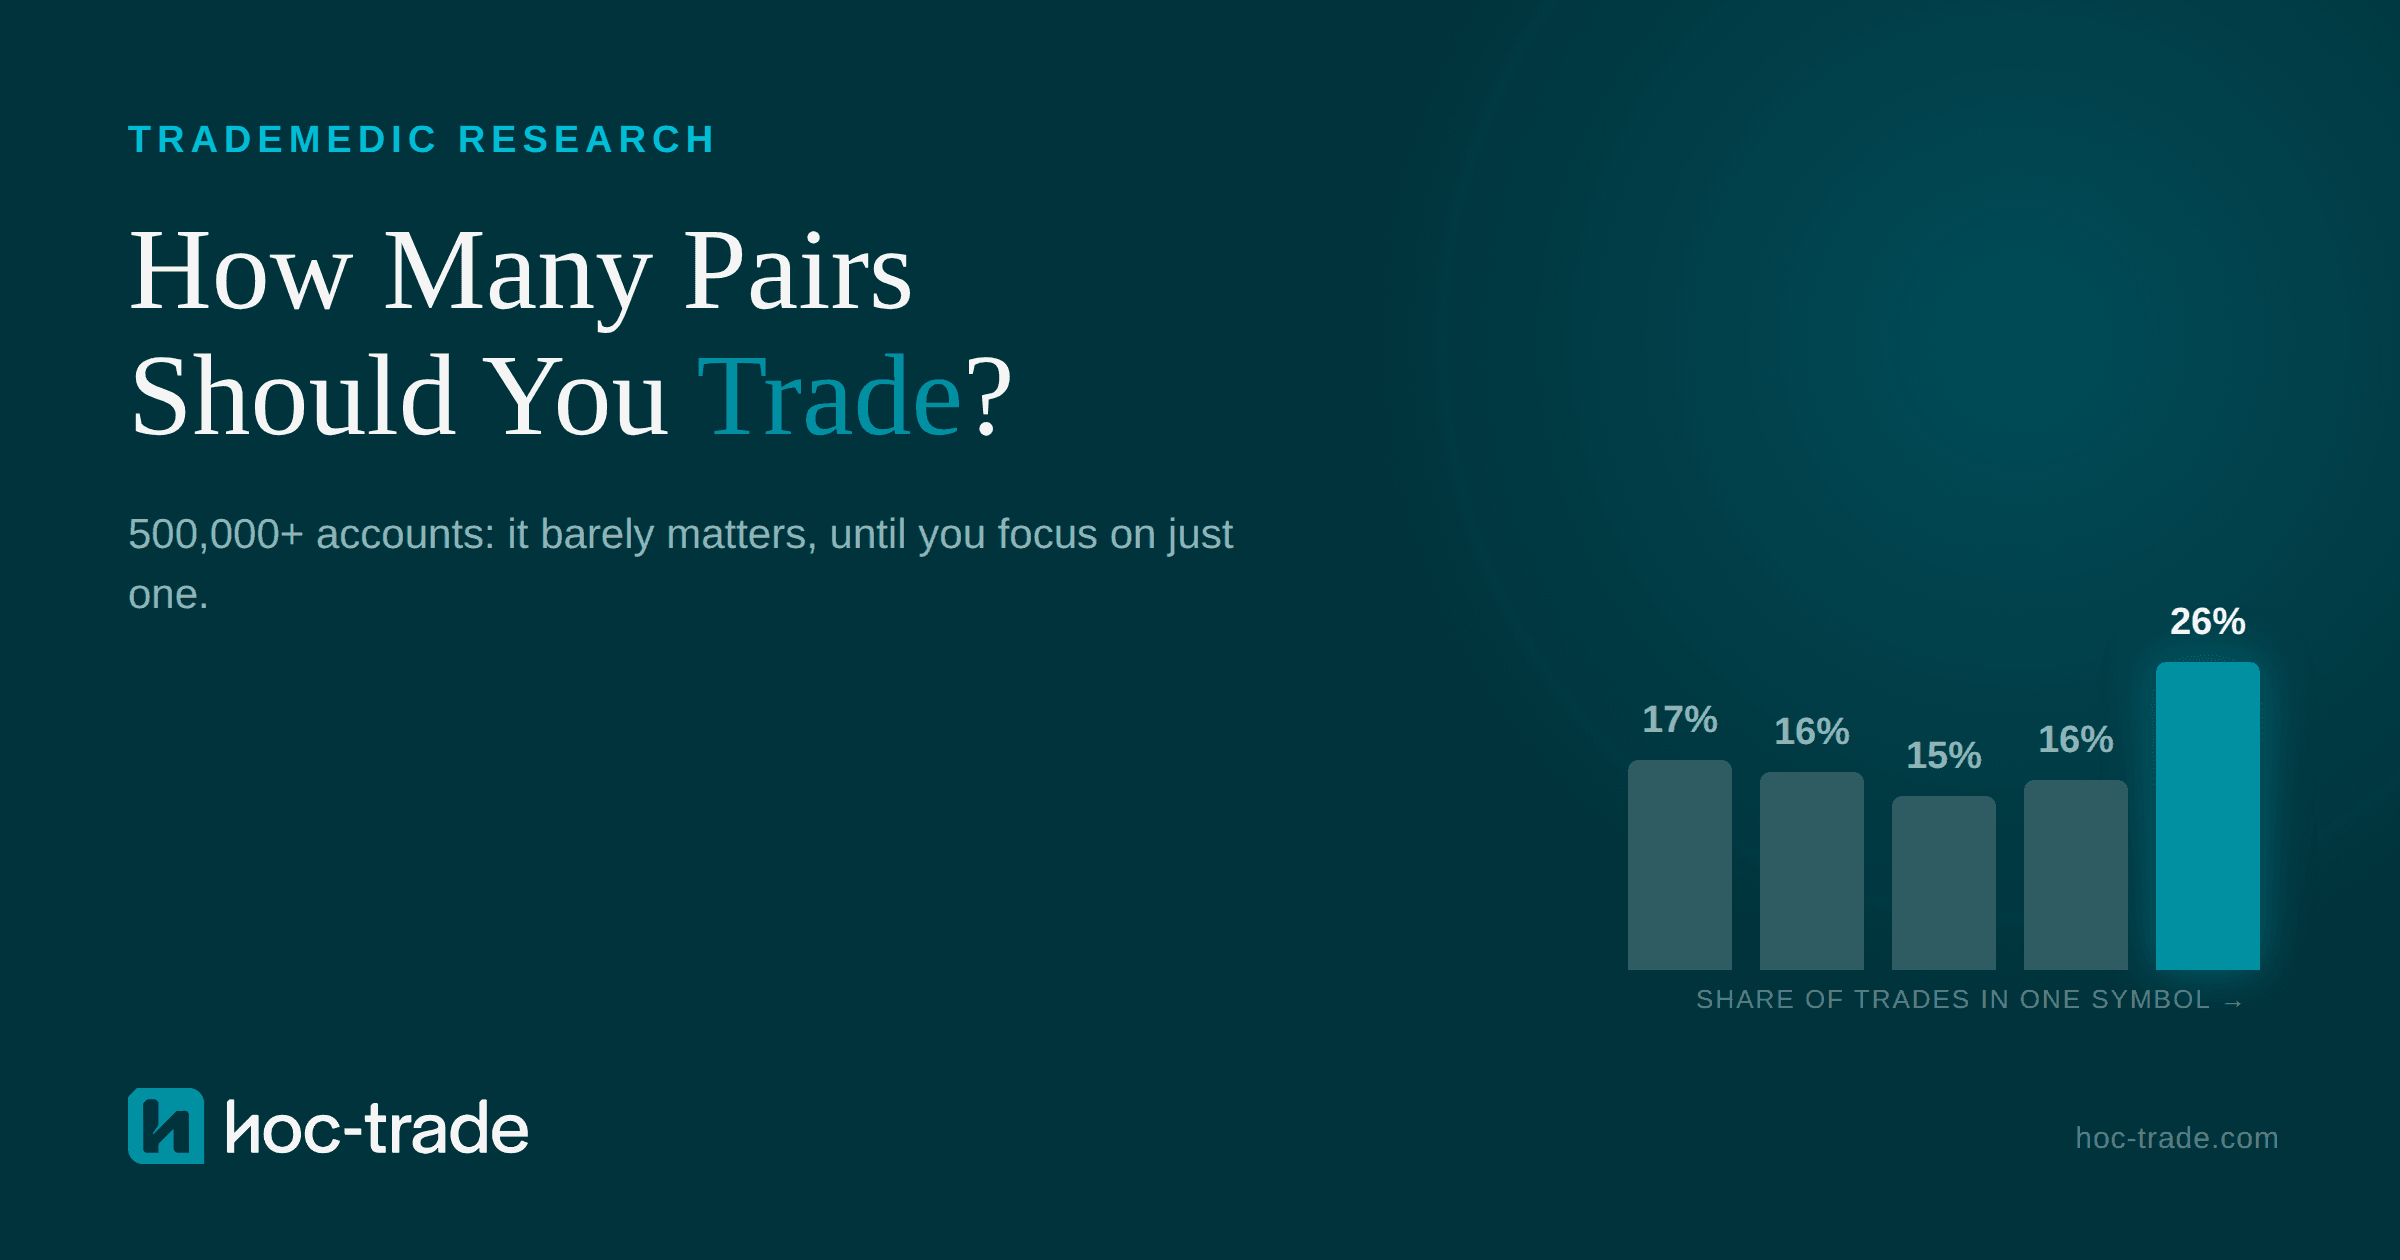
So we pulled the numbers. Across 500,000+ trader accounts analyzed by TradeMedic™ AI, we measured what share of each trader’s positions sat in their single most-traded symbol, then compared profitability across the full spectrum. The result is blunt: from heavily diversified to heavily concentrated, the share of profitable accounts stays inside a narrow band of 14.5% to 17.5%. Then, above 99% concentration in a single symbol, it jumps to 25.6%. Traders who trade essentially one symbol only are profitable 62% more often than all other traders combined.
How many pairs should you trade? What 500,000+ accounts show
We didn’t count watchlists or ask traders which market they consider their main one. For every account, we measured the share of all executed trades placed in that account’s most-traded symbol. A trader with 1,000 trades, 600 of them in gold, sits at 60%. That gives a clean, behavior-based measure of concentration that doesn’t depend on self-reporting.
The results across five groups: accounts with less than 25% of trades in their main symbol were profitable at a rate of 17.5%. Between 25% and 50%, the rate was 16.5%. Between 50% and 75%, it dropped to 14.5%, the lowest of any group. Between 75% and 99%, it recovered to 15.9%. Above 99%, it jumped to 25.6%.
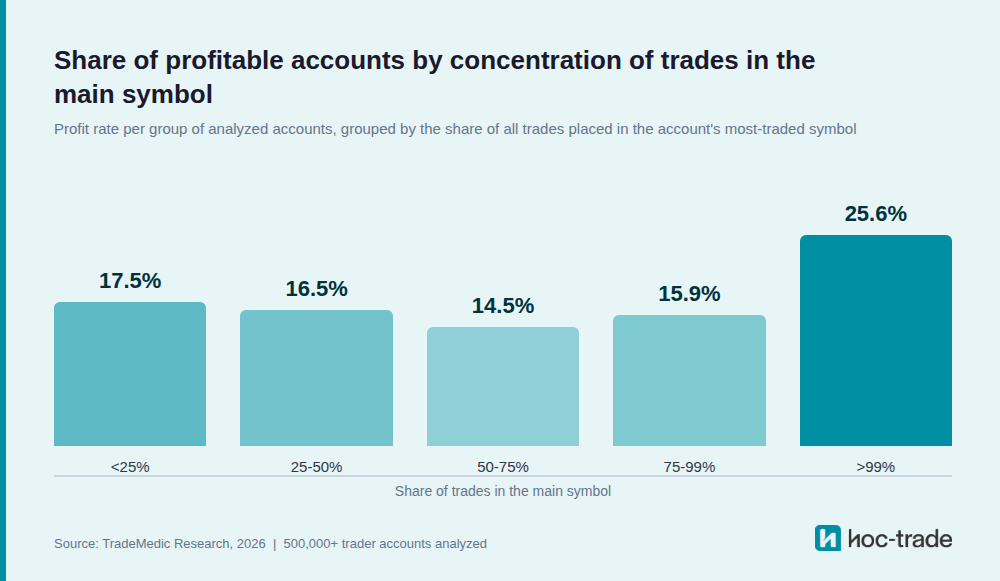
Every percentage refers to the share of accounts in that group that ended the analyzed period in profit. The pattern is hard to miss: four of the five groups sit within three percentage points of each other, and one group stands alone.
How many traders stick to just one symbol?
Before reading the profitability gap, it helps to know how traders behave in the first place. Concentration is not a niche choice. Roughly 1 in 4 analyzed accounts, 24%, place more than 99% of their trades in a single symbol. Another 31% sit between 75% and 99%. Taken together, more than half of all traders concentrate at least three quarters of their trades in one market. Broad diversification is the rare case: only 7% of accounts spread so widely that their main symbol holds less than a quarter of their trades.
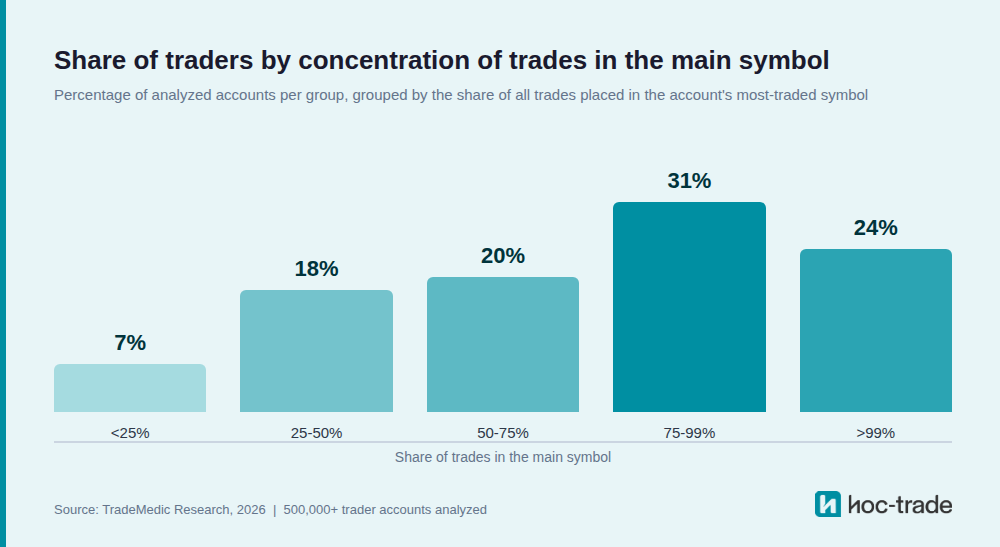
That distribution changes how the headline finding should be read. Most traders already lean heavily toward one symbol. But the measurable edge only appears in the strictest group. An account with 90% of trades in one market, which most people would describe as focused, performs statistically like a diversified one.
Trading multiple pairs vs one: why the middle barely moves
The common advice says trading fewer pairs improves results, full stop. Across most of the range, this data doesn’t support that. Moving from under 25% concentration to 75-99% concentration produces no upward trend at all. The most diversified group, at 17.5% profitable, outperforms the middle groups, and the 50-75% group is the weakest of all at 14.5%. The differences are small, three percentage points end to end, and they don’t move in a consistent direction.
In other words: whether you trade three symbols or fifteen, your position on the diversification spectrum says almost nothing about your odds of profitability. Symbol count, by itself, is not the lever it’s often made out to be.
This is where the popular one-to-three rule runs into the numbers. Two or three symbols puts a trader in the same flat band as someone trading a dozen, no better and no worse. The advice isn’t reckless, it just aims at a target the data doesn’t reward. The only group that pulls clear of the pack committed almost entirely to a single market, past 99% of trades. If the goal is the measurable edge, one to three isn’t focused enough.
Focus on one currency pair: the jump above 99% concentration
The exception is sharp. Accounts with more than 99% of trades in one symbol were profitable at a rate of 25.6%, against 15.8% for all other accounts pooled together. That makes them 62% more often profitable. Compared group by group, the one-symbol traders beat every other group by at least 45%.
And the threshold is strict. The 75-99% group, which includes traders with 95% or even 98% of trades in one market, shows none of this lift. The signal isn’t that fewer pairs is better. It’s that one symbol only is different.
Does the effect hold across scalping, day trading and swing trading?
Splitting the data by trading style shows the effect is not uniform. It’s driven almost entirely by the fastest styles. Among scalpers, single-symbol traders were profitable at 23.3%, against 14.8% for scalpers below that threshold, a 58% lift. Among day traders the gap is widest: 26.0% versus 14.8%, a 75% lift. Swing traders barely move, from 27.1% to 30.7%, a lift of just 13%.
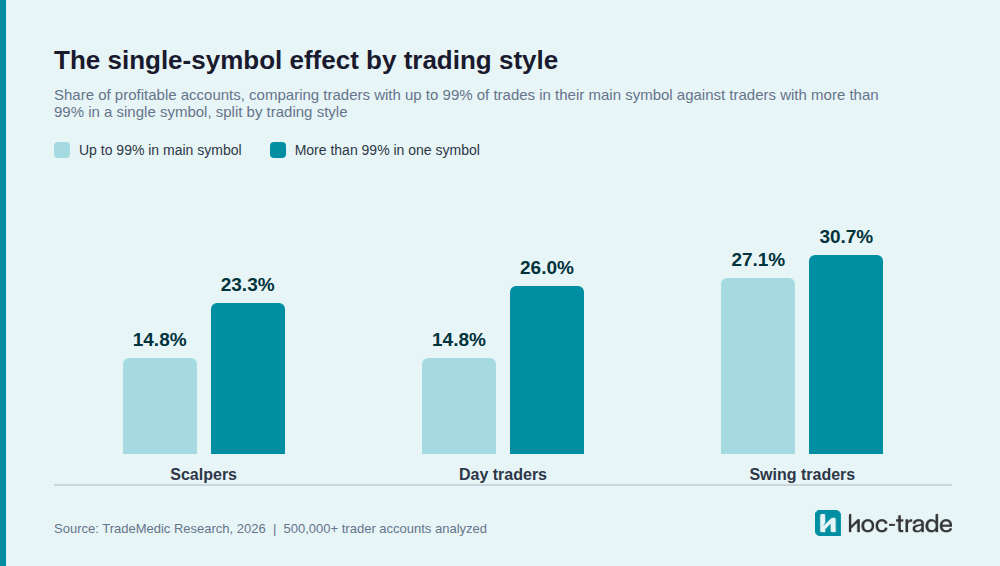
One point keeps this from being a style ranking. Swing traders start so far ahead that even without concentrating, they out-profit single-symbol scalpers and day traders, and their concentrated group at 30.7% is the strongest number in the entire grid. That baseline gap between styles is a finding in itself, covered in our analysis of day trading versus swing trading. The finding here is not that scalpers beat swing traders. It’s that concentration helps fast traders far more than slow ones. For a scalper or day trader, committing to one market moves the odds meaningfully. For a swing trader, it changes little.
That split is also the clearest hint at what’s driving the result, which is where the mechanism comes in.
Why trading one symbol only might pay
The data shows the association, not the mechanism, but the by-style pattern points somewhere specific. The styles that gain most are the ones that live on split-second familiarity with how a market moves. A trader who lives in one instrument learns how it behaves around session opens, how it reacts to news, what its normal range looks like on a quiet day. There is no context switching between instruments with different volatility profiles and different rhythms. The process gets settled and repeatable. And the feedback loop is cleaner, because every result feeds learning about the same market instead of being spread across ten. For a scalper reading order flow in seconds, that depth is decisive. For a swing trader holding for days, it matters less, which is exactly what the numbers show.
Attention is the other half of it. Faster styles demand far more of it: a scalper or day trader has to read and react in real time, often within seconds, and that kind of focus doesn’t divide well. Splitting it across several symbols at once means watching each one less closely, at exactly the moments when a missed detail costs the most. One market lets that attention stay whole. A swing trader, deciding over hours or days, can spread across more instruments without the same penalty, which is part of why concentration does so much less for them.
What this data does not say
Correlation isn’t cause, and this finding deserves that caution more than most. Near-total concentration may be a marker of traders who already found an edge and stopped searching, rather than the source of the edge itself. A trader who discovered they perform well in gold will naturally end up with most trades in gold. Switching your account to a single symbol tomorrow doesn’t automatically move you from the 15.8% group to the 25.6% group.
Two smaller notes on reading the numbers. All percentages here are shares of accounts, not returns: a group being profitable at 25.6% means 25.6% of the accounts in that group ended the analyzed period in profit. And profitability remains hard everywhere in the dataset. Even in the best group, roughly 3 in 4 accounts were not profitable over the analyzed period.
How to apply this to your own trading
If you trade many symbols and you’re profitable, this data gives you no reason to change anything. Across the whole middle of the spectrum, symbol count isn’t what separates winners from losers. If you’re struggling and your trades are scattered across a dozen markets, consolidating to one is a reasonable experiment: the only group with a measurably better profit rate is the one that committed to a single symbol.
It also helps to separate three questions that sound alike. How many symbols you trade over time is what this article measured. How many symbols you hold open at once is a different behavior with its own finding, covered in our analysis of symbol focus. And whether there is one specific instrument you consistently outperform in is a third question, the symbol expert pattern. All three are detected separately, and more of our population findings are collected on our research page.
Your own account already answers the personal version of this question. TradeMedic™ AI breaks down performance per symbol across your full trade history, showing which instruments contribute to your results and which quietly cost you. You can learn more about TradeMedic AI or connect your trading account free and see where your own concentration sits.
Source: TradeMedic Research, 2026.