Category:
 Author:
 Date:Jul 2, 2026
The Real Reason Most Traders Fail the Prop Firm Challenge (500,000+ analyzed)

You paid the challenge fee, you've been profitable in the past, you start your prop firm challenge, and then somewhere around day four, one bad session put you below the daily loss limit, and the account was gone before you ever reached the profit target.
If that sounds familiar, the explanation you've probably been given is wrong. You didn't fail the prop firm challenge because your strategy was bad. You failed because of how you behaved when the account was under pressure, and that is a different problem with a different fix.
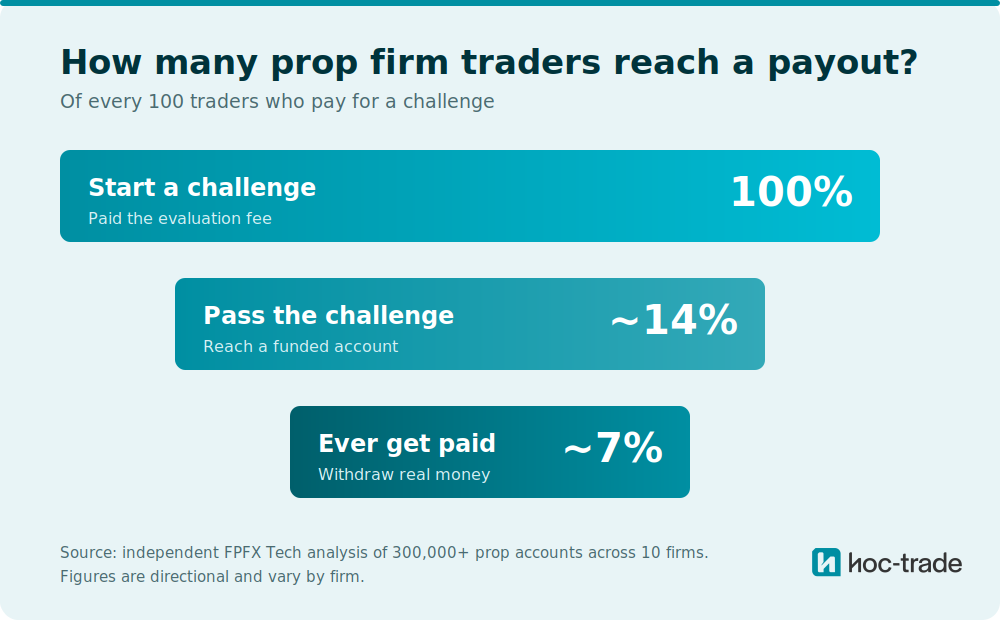
Start with one number. Across an independent analysis of more than 300,000 prop accounts, only about 7% of traders ever reached a payout, and most of the failures behind that number do not happen at the finish line. They happen in the first week, on a loss-limit breach, before the trader ever gets near the profit target. That timing is the tell, and it points straight at behavior rather than strategy.
This article does not stop at that observation. Further down, each specific way a challenge ends is mapped to a named behavioral pattern, with the share of an affected trader's losses that pattern is responsible for, drawn from 500,000+ analysed trading accounts. The point is to show you exactly which behaviors end challenges, and how to tell whether they show up in your own trading.
How many prop firm traders get paid?
The honest answer is: very few, and the published numbers vary by firm and aren't independently audited, so treat any single figure as directional.
The most reliable data point comes from an independent analysis rather than a firm's own marketing. When the fintech provider FPFX Tech analysed more than 300,000 prop accounts from 100,000 traders across ten firms, only 14% passed a challenge and just 7% of all traders ever reached a payout. Firm-reported pass rates tend to sit in a similar range, commonly cited between 5% and 10%, with one of the more transparent firms historically citing around 9–10% for its two-step challenge. These are self-reported, so read them as a rough guide, not a precise measurement.
Whichever number you trust, the shape is the same. The large majority of people who pay for a challenge never see a funded account, and a smaller group still ever withdraws real money. Put plainly: roughly 1 in 7 traders passes a prop firm challenge, and only about 1 in 14 ever reaches a payout.
Here is the part that matters, and the part almost no one tells you. The failures do not happen at the finish line. They happen in the first week.
The typical failure is not a trader who reaches day 25 and misses the profit target by a fraction. It is a trader who breaches the daily loss limit in the first few sessions. One widely cited industry breakdown attributes 71% of first-phase failures to daily drawdown breaches rather than to the overall maximum drawdown or to a missed profit target. A trader who simply survives two weeks without a drawdown breach already has dramatically better odds than the headline pass rate suggests.
That single fact reframes everything. If most challenges end on a risk-rule breach in the first few days, then the challenge is not primarily a test of whether your strategy is profitable. It is a test of whether you can manage your own behavior under a hard floor. And behavior is measurable.
Why a challenge punishes behavior more than a live account does
On your own account, a bad emotional session is a setback. On a challenge account, it can be terminal, because the structure removes the room that normally absorbs your mistakes.
A challenge account gives you a narrow loss window. On a $10,000 account with a 5% daily loss limit, you cannot lose more than $500 in a single day. The overall drawdown, often around 10%, gives you a $1,000 floor for the entire evaluation. That is a tiny gap between where you start and where you are liquidated. A few normal losing trades sized at 2% already put you in danger; a single emotional escalation can clear the limit in one session.
This is why the same behavioral pattern that quietly costs you money over a year on a live account can end a challenge in an afternoon. There is no account life for the damage to spread across. The floor is right there.
Here is the part that does not add up if you assume strategy is the problem. A strategy's drawdown is the single easiest thing in trading to control. Any trader can halve their position size, tighten their risk per trade, or cap their daily trades so that even a bad run stays inside the daily loss limit. If failing challenges were really mostly about strategy, traders would simply size down until the math fit the rules, and pass rates would not sit in the single digits. The fact that the large majority still never reach a payout, even though the fix for a pure strategy problem is this obvious, tells you the real constraint is not the strategy. It is what the trader does in the moment, when a position moves against them and the plan to size down quietly gets abandoned. That is behavior, and behavior is what the rest of this article measures.
That distinction is the key to the rest of this article. Below, each common way a challenge ends is mapped to a specific, detectable behavioral pattern. The figures attached to each pattern describe how much of an affected trader's total losses that one behavior is responsible for, measured across accounts of a comparable size. They show how heavily the behavior weighs on the traders who have it. On a challenge account, the point is not the share over a long history. It is that a single episode of the same behavior can breach a limit in one session.
Why do traders breach the daily loss limit in a prop firm challenge?
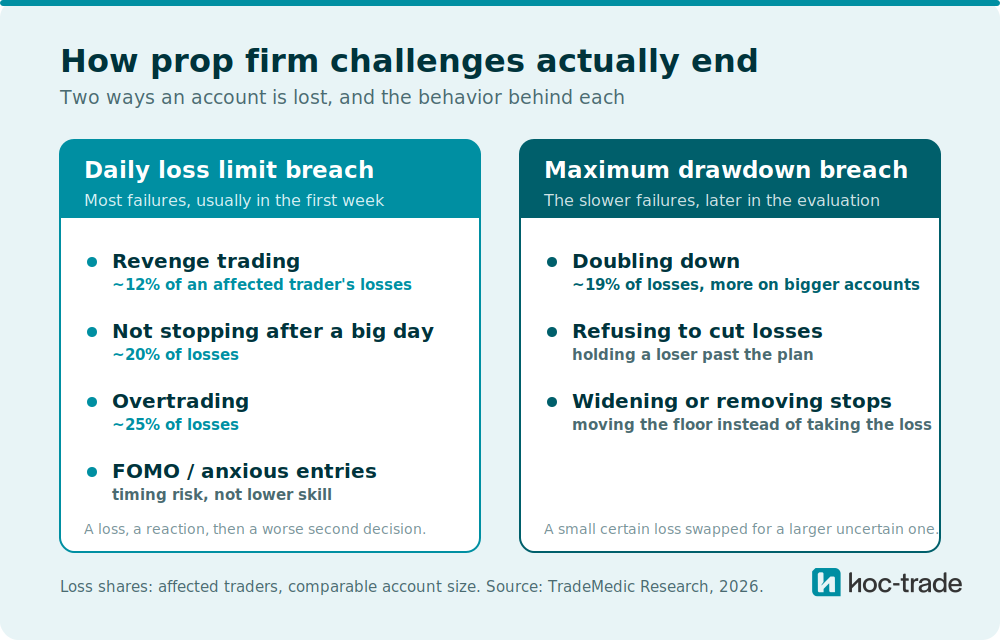
Most first-week failures come from the same place: a loss, then an emotional response to that loss, then a second decision that is worse than the first. Here are four patterns that drive it.
Revenge trading. This is the attempt to win back a loss immediately, in the minutes right after it lands. Across the dataset, revenge trading appears in the top five improvement areas for 15.7% of traders and has a measurable effect on 37.1% of them. Among affected traders on accounts of a comparable size, it accounts for roughly 12% of everything they lose. On a challenge, the mechanism matters more than the share: revenge trading concentrates its damage in the first minutes after a loss, which is exactly the window where a 5% daily limit is easiest to breach.
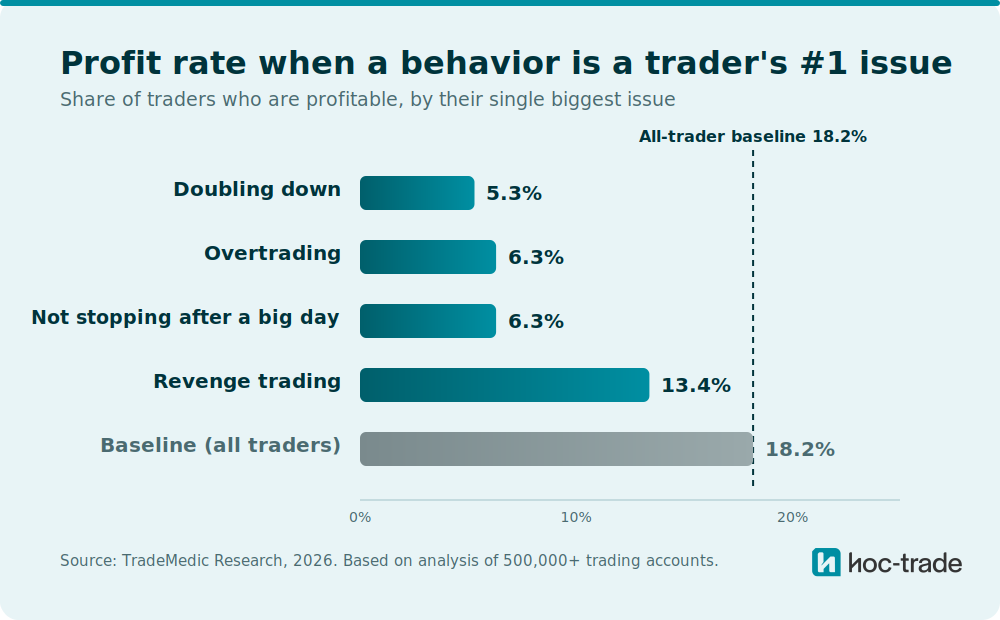
Fail to call it a day. This is the inability to stop after a heavy session, whether the day has gone badly or unusually well. It is the single most common improvement opportunity in the entire dataset, in the top five for 52.1% of traders and affecting 75.6%. When it is a trader's number one issue, their profit rate collapses to 6.3% against an 18.2% baseline. On a challenge account, "one more trade to get back to flat" after you are already near the daily limit is the classic final mistake.
Overtrading. Trying to hit the profit target fast, traders take more trades than their edge supports, and the extra trades perform worse. Overtrading sits in the top five for 40.3% of traders and affects 49.5%, and among affected traders it accounts for around a quarter of their total losses. When it is a trader's number one issue, their profit rate falls to 6.3%. The challenge clock makes this worse: the pressure to reach the target in limited days pushes traders into exactly the high-frequency activity that erodes performance and burns through the daily limit.
FOMO and anxious entries. Entering late on a move that has already run, with no plan and no defined exit. This pattern is unusual in the data, and the nuance matters: traders whose top issue is anxious or impatient entries are often otherwise profitable, because the entries are early rather than wrong. What they cost is forfeited upside and, on a challenge specifically, a timing problem. An impulsive entry into an extended move on the wrong day can trip the daily limit before the trade was ever part of a plan.
When one of these is a trader's single biggest issue, the effect on their odds is stark. Against a baseline where 18.2% of traders are profitable, that figure drops to 13.4% when revenge trading is the top issue, and to 6.3% for both overtrading and the inability to stop after a heavy session.
What causes a maximum drawdown breach?
Some traders survive the first week and then lose the account to the overall drawdown floor instead. This is usually a different pattern set, built around refusing to accept a loss.
Doubling down. Adding to a losing position to lower the average entry, betting that a reversal will rescue both. When it is a trader's number one issue, their profit rate is 5.3%, the lowest of any pattern here, against an 18.2% baseline. Among affected traders it accounts for close to a fifth of their total losses, and that share climbs sharply on larger accounts. On a challenge, doubling down is how a small, recoverable loss becomes a max-drawdown breach in a single position.
Refusing to cut losses and widening stops. The same underlying driver, loss aversion, shows up as moving a stop further away rather than taking the loss, or removing it entirely. The behavior trades a small certain loss now for a larger uncertain one later, which is precisely what a max-drawdown rule is built to catch.
What separates the traders who pass
The traders who get funded are rarely the ones with the most dramatic edge. They are the ones whose behavior is boring under pressure. They size small, they stop when the day is done, they take the loss when it is a loss, and they do not try to win the challenge in a single afternoon. Independent coverage of the industry reaches the same conclusion from the outside: firms are looking for traders who can produce steady returns without blowing up, not gamblers chasing a home run.
The difference between the two groups is not usually visible in a strategy backtest. It is visible in the trade history, in the timing of entries after a loss, in the number of trades on a losing day, in whether stops move. That is the layer a challenge tests, and it is the layer most traders never measure on themselves before they pay the fee.
How TradeMedic™ AI detects these patterns before they cost you a challenge
TradeMedic™ AI analyses your actual trade history and flags more than 60 behavioral patterns, including every failure mode above, by looking for the statistical signatures they leave in your data.
Revenge trading, for example, is detected by correlating the length of the break you take after a loss with the performance of your next trade: if only your short-break re-entries underperform, the pattern is present. Overtrading is found by correlating the number of trades you take in a day against how those trades perform. Fail to call it a day is detected when your performance drops after large daily gains or losses. Each pattern is identified, quantified in dollar terms, and ranked by its impact on your account, drawn from comparison against 500,000+ analysed accounts.
For a prop firm trader, the value is partly the timing and partly the coverage. You can connect a challenge account you are trading right now, or a previous one you have already failed, and see exactly which of these patterns showed up in it. You can also connect more than one account and merge them, several past challenge attempts together, or your challenge accounts alongside your live trading, into a single combined picture of how you behave under pressure. It is not only about connecting a prop or broker account to study your behavior; it is about assembling the full history of how you have traded, including the accounts that ended in a breach, so you can work on the specific behavior most likely to end the next challenge rather than retaking the same evaluation three times and paying the fee each time.
The bottom line
Most prop firm traders do not fail because their strategy cannot make money. They fail because a challenge account, with its narrow daily and overall loss limits, punishes behavioral patterns that a normal account would absorb. The damage is usually done in the first week, on a daily loss limit breach, driven by revenge trading, overtrading, and the inability to stop. The slower failures come from doubling down and refusing to cut losses into the maximum drawdown.
Every one of those patterns is detectable in your trade history before you start. The question is whether you find out from your own data, or from a failed challenge and another fee.
Learn more: See how TradeMedic™ AI analyses 60+ behavioral patterns
Connect your account (free): Check which of these patterns show up in your own trading
Frequently asked questions
What percentage of prop firm traders get a payout?
Independent analysis of 300,000+ accounts across ten firms found about 14% pass a challenge and roughly 7% of all traders ever reach a payout. Firm-reported pass rates commonly fall between 5% and 10%, though these are self-reported and vary by firm, program, and account size.
How many traders get a funded account from a prop firm challenge?
Roughly 1 in 7 traders passes the challenge and reaches a funded account, based on independent analysis of 300,000+ accounts. The rate varies by firm, program, and account size, and passing the challenge is not the same as reaching a payout: only about 1 in 14 traders ever withdraws money.
Why do most prop firm traders fail their challenge?
Most fail on a risk-rule breach in the first week, not on a missed profit target. Industry data attributes the majority of first-phase failures to daily loss limit breaches, which are driven by behavioral patterns like revenge trading, overtrading, and the inability to stop after a heavy session, rather than by a flawed strategy.
What is the most common reason for failing a prop firm challenge?
Breaching the daily loss limit early in the evaluation is the most common single cause. Maximum drawdown breaches, usually from doubling down or refusing to cut losses, end a smaller share of challenges later in the evaluation.
Is passing a prop firm challenge about strategy or psychology?
Mostly psychology and behavior. With a 5–10% pass rate concentrated on early risk-rule breaches, the evaluation tests whether a trader can manage their own behavior under a hard loss floor far more than whether their strategy is profitable.
Can you tell if you'll fail a prop firm challenge before you start?
The behavioral patterns that cause challenge failures, such as revenge trading and overtrading, leave statistical signatures in your past trade history. Tools like TradeMedic™ AI analyse that history against 500,000+ accounts to flag which failure patterns already appear in your trading before you pay an evaluation fee.