Category:
 Author:
 Date:Jul 26, 2026
Trading Fees by Instrument: What a Spread Really Costs Once You Measure It Properly

Ask which instrument is cheapest to trade and you will get a list of spreads. EURUSD from 0.8 pips. Gold from 20 cents. NAS100 from one point. These numbers are quoted in different units, on instruments priced from one dollar to twenty-two thousand, and they are compared as if that does not matter.
It matters more than anything else about them. A spread is only a cost in relation to the movement you are trying to capture. A one-point spread on an index that moves three hundred points a day is trivial. The same one point on an instrument that moves ten points a day would be ruinous. The only honest way to compare trading costs across asset classes is to measure the spread against the daily range, and once you do, the ranking inverts. The markets that look cheapest by their headline spread turn out to be the most expensive, and that has a direct effect on which traders finish net profitable.
How do you compare trading costs across different instruments?
Not by the spread alone. A spread quoted in pips, points, or cents tells you nothing until you know two more things: the price of the instrument, which converts the spread into a percentage, and the average daily range, which tells you how much movement is available to cover that cost.
Express the spread as a percentage of price, then divide by the average daily range as a percentage of price, and you get a single comparable figure: how much of a typical day's movement the spread consumes before you make a cent. That number can be compared directly across currency pairs, indices, and gold, which the raw spreads cannot.
What does each instrument really cost to trade?
Using typical standard-account spreads and the average daily range for each instrument, the cost of entry looks like this.
Instrument | Spread cost as share of daily range |
EURUSD | 2.1% |
GBPUSD | 2.1% |
SPX500 | 1.0% |
NAS100 | 0.7% |
US30 | 0.6% |
XAUUSD (gold) | 0.4% |
Source: TradeMedic Research, 2026
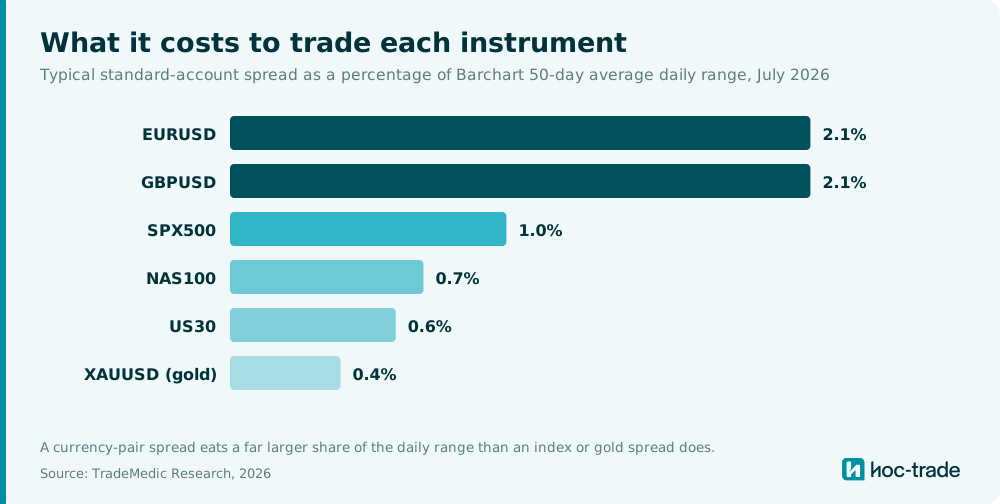
The order is the reverse of what most traders assume. The major currency pairs, marketed as the tightest-spread instruments available, are the most expensive to trade relative to how far they move. A EURUSD spread consumes about 2.1% of a full day's range. Gold, whose spread in cents looks large next to a fraction-of-a-pip forex spread, consumes only about 0.4%, because gold travels so much further in a day. On this measure a EURUSD trade costs roughly five times what a gold trade costs.
The reason is not that forex brokers charge more. It is that the majors barely move. EURUSD covers around half a percent of its price on an average day, while gold covers close to two and a half percent. A tight spread on a tight range is still a large share of that range. A wider-looking spread on a wide range is a small one.
Why are forex scalpers so unprofitable?
Forex scalpers are so unprofitable because cost per trade compounds with how often you trade, and a currency-pair spread is a large share of the small move a scalper chases. The traders who trade most often are the ones this cost hits hardest.
A scalper opens and closes many small positions in a session, and every one has to clear the spread before it shows a profit. If the spread is 2.1% of the day's range, a scalper trying to skim a small piece of that range is handing back a large fraction of every winning trade and paying it in full on every losing one. If the spread is 0.4%, the same approach has room to work.
This shows up directly in our analysis of 500,000+ trading accounts. Across the dataset, scalpers on EURUSD and GBPUSD combined finish net profitable at just 7.1%. Scalpers on gold finish at 20.2%, close to three times the rate, on the same behavior in a different instrument. The gap tracks the cost figures almost exactly. Gold gives a scalper roughly five times more movement per unit of spread, and gold scalpers keep roughly three times more of their accounts in profit.
There is a cleaner way to see what this cost does. Because the spread is a fixed cost paid on entry, it raises the win rate a trader needs simply to break even, and it raises it more the larger the spread is relative to the target. A scalper on a currency pair, aiming at a small target with a spread that is a large share of the day's range, has to win a meaningfully higher share of trades than a scalper on gold does just to stand still. That higher bar, repeated over hundreds of trades, is most of the difference between the 7.1% and the 20.2%.
A trader who holds for days barely notices the same spread, because it is paid once against a move measured in whole percentage points rather than fractions. This is why cost is close to irrelevant for swing traders and decisive for scalpers, even on the identical instrument.
The instrument is one axis of this; the speed you trade is the other. This article holds trading style constant and varies the instrument. Our analysis of day trading versus swing trading does the reverse, holding the instrument constant and showing how the same fixed cost forces a scalper to a much higher break-even win rate than a swing trader, purely because the scalper aims at a smaller target and pays the cost far more often. Read together, they explain why the worst place a retail trader can be is scalping a major currency pair: the highest-cost instrument traded at the highest-cost speed.
Which is cheaper to trade, forex or indices?
Indices, comfortably, once you measure cost against range. The three US indices consume between 0.6% and 1.0% of their daily range in spread, while the major currency pairs sit at 2.1%. Index trading is often assumed to be the more expensive, serious end of retail trading, and on cost per unit of movement it is the opposite.
This is worth stating clearly because it removes a common explanation for a real finding. In our comparison of forex vs indices, index traders finish net profitable at 12.3% against 19.6% for major currency pair traders. It would be natural to assume higher index costs drag that number down. They do not. Indices are cheaper to trade relative to their range, so the underperformance of index traders comes from something else, which that article traces to how fast indices are traded rather than what they cost.
Does gold being cheap to trade make it a good instrument?
No, and this is the trap in reading a cost table on its own. Gold is the cheapest major instrument to trade per unit of movement, and gold traders still finish net profitable at only 17.7%, marginally below the population baseline of 18.2%.
Low cost is a floor, not an edge. It means the instrument is not working against you before you start, which is why gold is the one market where scalping is survivable. It does not supply a strategy, control position size, or stop a trader holding a loser too long. Cost decides how much of your edge survives execution. It does not create the edge.
This cuts the other way too, and it is worth sitting with. Because a low-cost instrument lets weaker traders survive longer, a profitable gold trader has cleared a lower bar than a profitable EURUSD scalper, who had to overcome a cost structure five times harsher to finish ahead. Low cost flatters the trader by keeping the mediocre in the game; high cost filters, so the survivors are more likely to have something real. Our analysis of the best timeframe to trade gold covers why gold lands at the population average despite its low cost.
What about overnight financing and commissions?
The spread is the largest cost for most retail traders but not the only one, and the two costs this comparison leaves out both fall on longer holders rather than the fast traders the spread punishes.
Commissions on standard accounts are usually zero, folded into the spread, which is why a spread-based comparison captures most of the entry cost for the majority of retail traders. Raw-spread accounts charge a separate commission but quote tighter spreads, so the all-in cost lands in a similar place for an active trader.
Overnight financing is charged on positions held past the daily rollover, and index CFDs in particular carry it. This cost grows with holding time, so it falls on swing traders, not scalpers, and it does erode part of the advantage that low per-trade costs hand the slower styles. In the index population, swing traders are a small minority and the one index group that performs well, so the cost the spread comparison omits lands on the traders least in need of an explanation for poor results. For the intraday majority who close before rollover, the spread is the cost that matters, and it is the one measured here.
How TradeMedic™ AI accounts for trading costs
Population figures describe instruments in general. They cannot tell you what your own trading costs you.
TradeMedic™ AI connects to your MT4 or MT5 account and analyzes your real trade history across 60+ behavioral patterns, quantifying each in dollars against your own results. Where cost intersects behavior, the report makes it visible. Trading frequency is one of the patterns it measures, and our data shows accounts trading under five times a day finish net profitable at a far higher rate than those trading more than twenty-five times, in part because every extra trade is another spread paid. The report calculates your own frequency and its effect on your results rather than leaving you to estimate it.
It also identifies your best-performing holding period from your own history, which is the single decision that most changes how much your spread costs you. The same instrument and the same spread produce very different outcomes depending on whether you pay that cost once a week or forty times a day.
The bottom line
A spread quoted in pips or points is not a cost until you measure it against how far the instrument moves. Do that, and the ranking inverts. The major currency pairs, at about 2.1% of daily range, are the most expensive instruments to trade, while gold at 0.4% and the indices between 0.6% and 1.0% are the cheapest.
That cost is close to irrelevant if you hold for days and decisive if you scalp, which is why EURUSD scalpers finish net profitable at 7.1% while gold scalpers reach 20.2%. It also clears trading fees as an explanation for why index traders underperform, since indices are cheaper to trade than forex, not more expensive.
Cost decides how much of your edge survives execution. It does not create the edge, and no instrument is cheap enough to rescue a strategy that does not work.
Learn more about TradeMedic™ AI
Connect your trading account to TradeMedic™ AI free
Methodology
Spread figures are typical broker standard commission-free account spreads as of 2026. Average daily range is taken from Barchart's 50-day figure as of July 2026 for all six instruments. Trading cost is expressed as the spread as a percentage of price divided by the average daily range as a percentage of price, giving the share of a typical day's movement consumed by the spread. Profit rates are drawn from analysis of 500,000+ trading accounts and mean the share of accounts in a group that finished net profitable across their analyzed history. The comparison is illustrative of relative cost across asset classes; exact costs vary by broker, account type, and market conditions.
Source: TradeMedic Research, 2026
Frequently asked questions
How do you compare trading costs across different instruments?
Not by the spread alone, since spreads are quoted in different units on differently priced instruments. Express the spread as a percentage of price, then divide by the average daily range as a percentage of price. That gives the share of a typical day's movement the spread consumes, which is comparable across currency pairs, indices and gold.
Which is cheaper to trade, forex or indices?
Indices, measured against daily range. The three US indices consume between 0.6% and 1.0% of their daily range in spread, while EURUSD and GBPUSD sit at 2.1%. Index trading is often assumed to be more expensive, and on cost per unit of movement it is the opposite.
What is the cheapest instrument to trade?
Among major instruments, gold, which consumes about 0.4% of its daily range in spread, because gold moves far enough in a day that even a spread of 20 to 30 cents is a small share of the range. The major currency pairs are the most expensive at about 2.1%.
Why are forex scalpers so unprofitable?
A EURUSD spread consumes roughly 2.1% of a full day's range against about 0.4% for gold. A scalper clears the spread on every one of many small trades, so a currency-pair scalper pays a far larger share of the available move each time. In analysis of 500,000+ accounts, EURUSD and GBPUSD scalpers finish net profitable at 7.1% against 20.2% for gold scalpers.
Does a low spread make an instrument profitable?
No. Low cost means the instrument is not working against you before you start, but it does not supply a strategy or manage risk. Gold is the cheapest major instrument to trade and gold traders still finish net profitable at 17.7%, marginally below the population baseline. Cost decides how much of your edge survives execution rather than creating the edge.