Category:
 Author:
 Date:Jul 26, 2026
Forex vs Indices: Which Is More Profitable? Evidence From 500,000+ Accounts

Comparisons of forex and indices tend to cover the same ground. Indices track a basket of stocks, currency pairs track the relative value of two currencies, both are traded through CFDs, and both are liquid. Two things are missing from all of them. First, they cannot agree on which market is more volatile, with some sources calling indices the calmer choice and others the wilder one, and none of them settles it with a number. Second, they never say which market retail traders do better in.
We can settle both, and the data here describes retail CFD traders specifically, meaning traders taking leveraged positions on price movement rather than owning the underlying index or holding currency at a bank. Across 500,000+ CFD trading accounts, traders whose main instrument is a major currency pair finish net profitable at 19.6%, against 12.3% for traders whose main instrument is an index. The all-trader baseline is 18.2%, so currency traders sit above it and index traders well below. On the volatility question, NAS100 runs annualized volatility near 20% against roughly 7% for EURUSD, so indices are the more volatile market by a factor of about three.
Forex vs indices: which is more profitable?
Forex is more profitable: major currency pair traders finish net profitable at 19.6% against 12.3% for index traders, roughly 1.6 times the rate. Grouping traders by most-traded instrument produces the gap: major currency pair traders, meaning those whose main instrument is EURUSD or GBPUSD, sit at 19.6%, while index traders, meaning those whose main instrument is NAS100, US30 or SPX500, sit at 12.3%.
Broken out by instrument, no index reaches the baseline. GBPUSD returns 20.4% and EURUSD 19.2%, both above the 18.2% all-trader figure. SPX500 returns 14.6%, US30 14.0%, and NAS100 11.1%, all below it.
Major currency pair traders make up 12.1% of all accounts analyzed and index traders 6.7%.
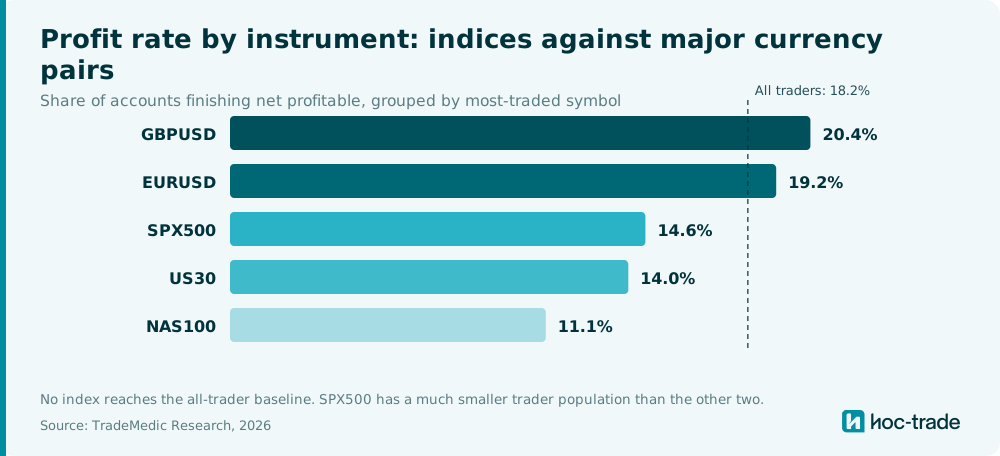
The result holds after removing automation. Excluding every account that runs an expert advisor on more than a quarter of its trades leaves the ranking unchanged, with each instrument shifting by roughly half a point.
Are indices more volatile than forex?
Yes, by a wide margin, and this is where the guides claiming otherwise are wrong.
NAS100 has an average daily range of roughly 1.26% of price and annualized volatility around 20%, measured on Barchart as of July 26, 2026. The major currency pairs run annualized volatility of 7.05% for EURUSD and 8.67% for GBPUSD, computed from Federal Reserve daily exchange rate series over the ten years to July 2026. Index traders are operating in a market that moves close to three times as much.
This matters more than it sounds, because volatility interacts with leverage. Retail CFD accounts often apply similar position sizing across instruments without adjusting for range. A lot size producing a manageable swing on EURUSD produces a much larger one on NAS100, and the account experiences a level of variance the trader did not consciously choose.
It also explains part of the profit gap without explaining all of it. Gold is more volatile than NAS100 on a daily range basis, at 2.38% against 1.26%, and gold traders still outperform NAS100 traders by more than six points. Volatility alone does not determine outcomes. What determines outcomes is whether the way a market moves matches the way you trade it.
Do indices cost more to trade than forex?
No, indices do not cost more to trade than forex; measured against daily range they cost less, so higher fees cannot be what drags index traders down. The objection is reasonable, that indices might simply be more expensive and that cost, not the traders, explains the gap, but the data points the other way.
Spread only becomes comparable across asset classes once you express it as a share of the daily range, because a two-point spread on an index and a one-pip spread on a currency pair are quoted in different units on differently priced instruments. Measured that way on standard commission-free accounts, the kind most retail traders use, a NAS100 spread consumes roughly 0.7% of an average day's range, US30 around 0.6%, and SPX500 around 1.0%. Gold sits near 0.4%. The major currency pairs consume roughly 2.1% of their much smaller daily range.
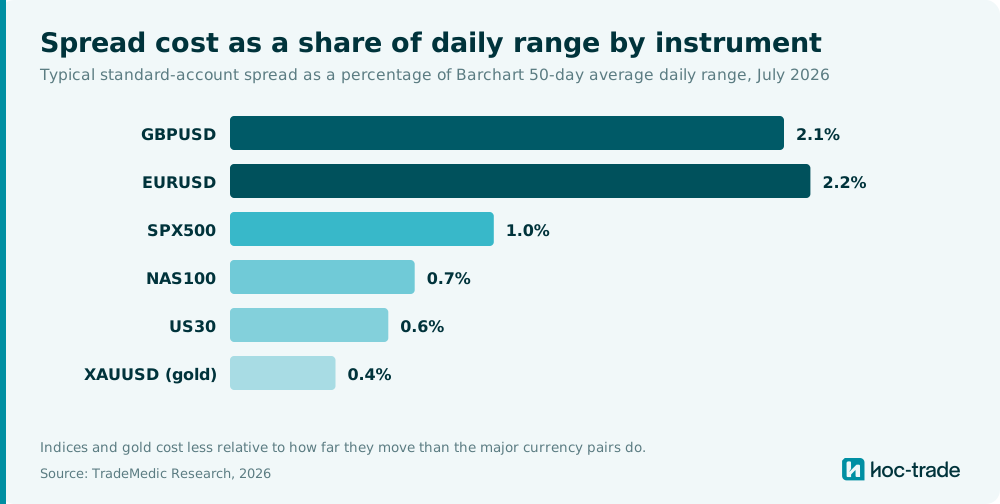
So indices are, if anything, cheaper to trade relative to how far they move than the major currency pairs are, and EURUSD, the best performing major, is the most expensive relative to its range. Cost and outcome run in opposite directions here. If fees drove profitability, the ranking would be the reverse of what the accounts show.
Two things keep this honest. Spreads vary by broker and account type, so these are typical figures rather than a single universal number, and the daily ranges are point-in-time readings that shift with market conditions. The direction of the effect is robust to that variation, since the gap between forex at roughly 2% and indices below 1% is far too wide to be closed by broker choice. And index CFDs carry overnight financing on positions held past the daily cutoff, which the spread figure does not capture. That cost falls on traders who hold longer, which in the index population is the small minority who swing trade, and swing traders are the one index group that performs well. So the holding cost the spread comparison omits lands on the group least in need of an explanation, not the intraday majority who underperform.
What is the best index to trade?
Among the three we measured, SPX500 performs best at 14.6%, followed by US30 at 14.0% and NAS100 at 11.1%.
Two caveats. All three sit below the 18.2% baseline, so best here means least difficult rather than good. And SPX500 has a much smaller trader population than the other two, so its figure carries more uncertainty and we would not lean on the ranking between SPX500 and US30.
The clearer finding is at the bottom. NAS100 is the most popular index by a wide margin, accounting for 4.1% of all traders against 2.1% for US30 and 0.6% for SPX500, and it is the worst performing. That is the same pattern gold shows within commodities. Popularity and outcomes are not correlated in this dataset.
Why do NAS100 traders lose money?
NAS100 traders lose money at the highest rate in the study: narrow the view to NAS100 day traders, who make up the large majority of NAS100 accounts, and the profit rate falls to 10.7%, the weakest result of any large group in the entire dataset.
Three things appear to compound. The instrument moves fast and trends hard, so a trader who is early stays exposed for longer and a trader who is wrong finds out expensively. The population trades it at the wrong speed, with more than 85% of index traders operating intraday. And index trading carries an air of seriousness that the outcomes do not support, which may make traders slower to question their approach.
Trading indices vs forex: how the trader populations differ
The two markets attract very different behavior, and the difference is larger than the headline profit gap.
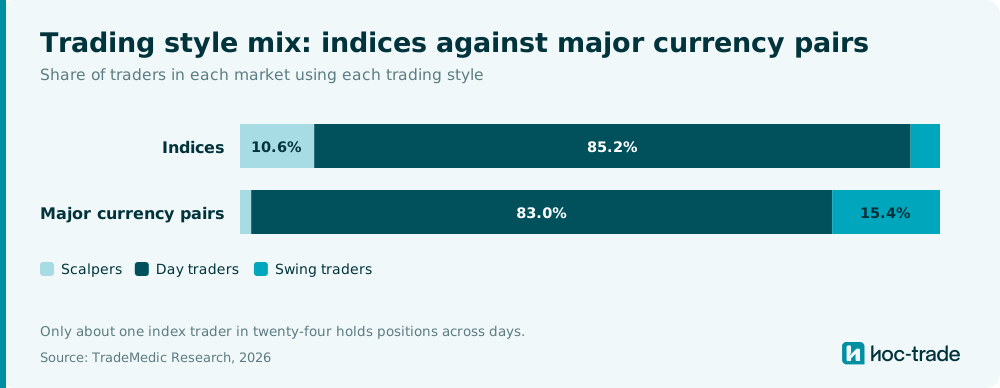
Among index traders, 10.6% scalp, 85.2% day trade, and 4.2% swing trade. Among major currency pair traders, 1.6% scalp, 83.0% day trade, and 15.4% swing trade. Index traders scalp at more than six times the rate of currency pair traders and swing trade at roughly a quarter of the rate. Only about one index trader in twenty-four holds positions across days.
Set that against how each style performs within each market. Index scalpers finish net profitable at 11.5% and index day traders at 11.8%, while index swing traders reach 23.7%. On major currency pairs the same three groups return 7.1%, 17.9% and 29.9%.
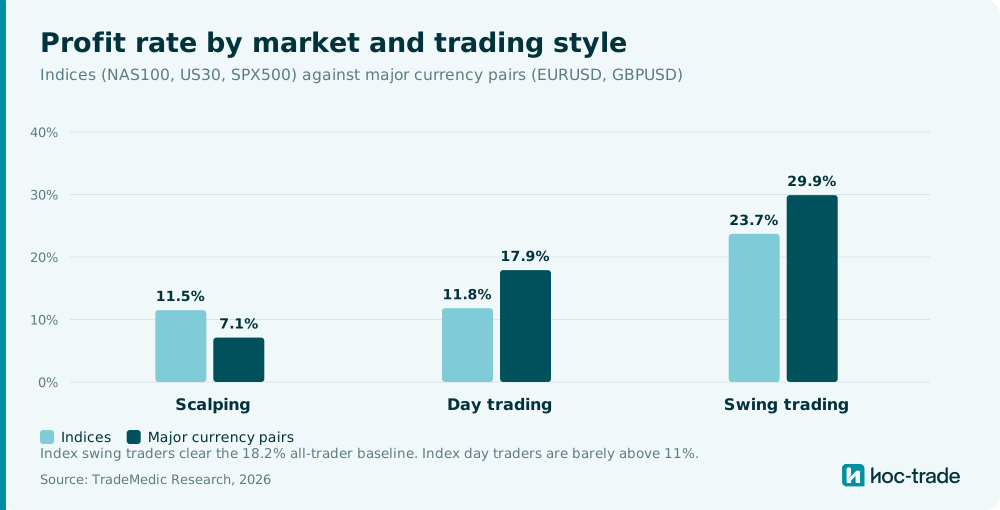
Index swing traders are the exception to everything else in this article. At 23.7% they clear the population baseline comfortably and land within six points of currency pair swing traders, despite operating in a market that moves three times as much. The problem with index trading is concentrated almost entirely in how quickly it is traded, and almost nobody trades it slowly.
Our wider analysis of day trading versus swing trading covers the style question across the full dataset, where swing traders finish net profitable at 27.5% against 17.3% for day traders.
Is forex or indices better for beginners?
Forex is the better starting point on this evidence, since index traders finish net profitable at 12.3% against 19.6% for major currency pair traders. Several guides suggest the opposite, that indices are the natural place to begin because a basket of stocks diversifies away single-company risk, but the outcomes do not support that ordering. The worst-performing large group in the entire dataset is NAS100 day traders at 10.7%.
Diversification within an index is real, but it addresses a risk retail CFD traders were not facing. A trader holding NAS100 intraday with leverage is not exposed to one company failing. They are exposed to a fast-moving index and their own position sizing, and the basket does nothing about either.
If the goal is the best odds while learning, the population data points toward major currency pairs and toward holding positions longer than a single session. Our full ranking across every instrument appears in the analysis of the best forex pair to trade.
How TradeMedic™ AI analyzes performance across markets
Population averages describe traders in general. They cannot tell you whether indices suit you.
TradeMedic™ AI connects to your MT4 or MT5 account and analyzes your real trade history across 60+ behavioral patterns, quantifying each in dollars against your own results.
Symbol Expert tests whether you consistently outperform on a specific instrument rather than simply trading it most often. If your index trades reliably beat your trades elsewhere, that is a measured edge. If they do not, familiarity has been standing in for skill. Our article on symbol expertise as a trading edge covers the detection logic.
The report also identifies your best-performing holding period from your own history. Given that index outcomes roughly double between intraday and multi-day holding, that is the single most useful number an index trader can have.
Position sizing deserves particular attention on indices. Our data on how much to risk per trade shows accounts risking under 0.5% per trade finishing profitable at roughly double the rate of those risking 2% to 5%, and that gap matters more in a market moving three times as much as a currency pair.
The bottom line
Across 500,000+ trading accounts, traders whose main instrument is a major currency pair finish net profitable at 19.6%. Traders whose main instrument is an index finish at 12.3%. No index reaches the 18.2% all-trader baseline, and NAS100 sits last at 11.1%.
Indices are also unambiguously the more volatile market, at roughly three times the annualized volatility of EURUSD, which settles a point on which existing comparisons contradict each other.
The most useful finding is that the gap is almost entirely about speed. Index swing traders reach 23.7%, comfortably above the baseline. Index day traders reach 11.8%. And only about one index trader in twenty-four holds across days.
Indices are not unprofitable. They are traded fast by nearly everyone who touches them, and fast is the wrong speed for a market that moves this much.
Learn more about TradeMedic™ AI
Connect your trading account to TradeMedic™ AI free
Methodology
Traders are grouped by their most-traded instrument, defined as the single symbol in which the account placed the highest number of trades. No minimum concentration threshold is applied. Indices combines traders whose main instrument is NAS100, US30 or SPX500. Major currency pairs combines EURUSD and GBPUSD. Profit rate means the share of accounts in a group that finished net profitable across their analyzed history. Trading style is derived from observed holding periods and trade frequency. NAS100 average daily range and annualized historic volatility are drawn from Barchart as of July 26, 2026, using the 50-day window. Currency pair annualized volatility is computed from Federal Reserve H.10 daily exchange rate series over the ten years to July 2026. Typical spread figures used in the trading cost comparison are drawn from published broker standard commission-free account pricing as of 2026, expressed as a share of each instrument's average daily range. Average daily range is taken from Barchart's 50-day figure as of July 2026 for all six instruments. The comparison is illustrative of relative cost across asset classes rather than an exact per-trade figure. Groups representing very small trader populations are flagged where relevant.
Source: TradeMedic Research, 2026
Frequently asked questions
Is forex or indices more profitable to trade?
Across 500,000+ trading accounts, traders whose main instrument is a major currency pair finish net profitable at 19.6%, against 12.3% for traders whose main instrument is an index. The all-trader baseline is 18.2%, so currency traders sit above it and index traders well below.
Are indices more volatile than forex?
Yes. NAS100 has an average daily range of roughly 1.26% of price and annualized volatility near 20%. EURUSD runs annualized volatility of 7.05% and GBPUSD 8.67%. Index traders operate in a market that moves close to three times as much as a major currency pair.
What is the best index to trade?
Among the indices measured, SPX500 performs best at 14.6%, followed by US30 at 14.0% and NAS100 at 11.1%. All three sit below the 18.2% all-trader baseline, so the ranking indicates which is least difficult rather than which is profitable.
Why do NAS100 traders lose money?
NAS100 day traders finish net profitable at 10.7%, the weakest result of any large group in the dataset. The instrument is fast and trends hard, and more than 85% of index traders operate intraday. Index swing traders reach 23.7%, roughly double the intraday rate.
Is forex or indices better for beginners?
The population data points toward major currency pairs. Index traders finish net profitable at 12.3% against 19.6% for major currency pair traders. The diversification benefit of an index addresses single-company risk, which is not the main risk facing a leveraged intraday CFD trader.
Do indices cost more to trade than forex?
No. Measured as a share of daily range on standard commission-free accounts, index spreads consume roughly 0.5 to 1.0% of an average day's move, against roughly 2.1% for major currency pairs. Indices are cheaper relative to how far they move, so trading costs do not explain why index traders underperform.