Category:
 Author:
 Date:Jul 26, 2026
Best Forex Pair to Trade? What 500,000+ Trading Accounts Show

Almost every guide to choosing a currency pair ranks the same way. It lists spreads, liquidity, and session hours, concludes that EURUSD is the sensible default, and stops there. Those are all inputs. None of them is an outcome.
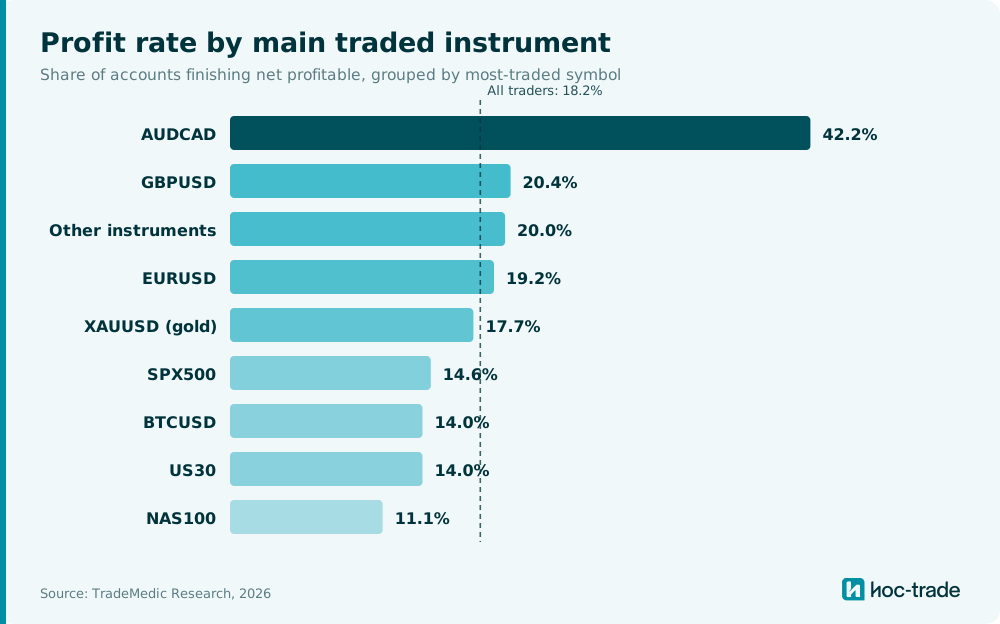
We have the outcomes here. Across 500,000+ trading accounts we grouped every trader by the instrument they traded most and measured how many finished net profitable. Against a population baseline of 18.2%, GBPUSD traders reach 20.4% and EURUSD traders 19.2%, while one cross, AUDCAD, reaches 42.2%. Gold, chosen by 65.9% of all traders, lands at 17.7%. NASDAQ finishes last at 11.1%. The ranking that follows does not match the one most guides produce.
What is the best forex pair to trade?
Among the currency pairs traded widely enough to measure, AUDCAD leads at 42.2%, GBPUSD follows at 20.4%, and EURUSD at 19.2%. All three sit above the 18.2% baseline, which already separates them from most of what retail traders choose.
The full ranking across every instrument in the study runs from AUDCAD at 42.2% down through GBPUSD at 20.4%, the combined group of all remaining instruments at 20.0%, EURUSD at 19.2%, gold at 17.7%, S&P500 at 14.6%, Bitcoin and Dow Jones both at 14.0%, and NASDAQ at 11.1%.
Removing automation changes nothing meaningful. Excluding every account that runs an expert advisor on more than a quarter of its trades leaves the order identical, with each instrument shifting by roughly half a point.
Which is the most profitable forex pair?
AUDCAD, by a wide margin. The result is unusual enough that we spent considerable effort trying to explain it away before publishing it, and it survived every filter.
It is not automation. Only about one in eight AUDCAD-primary accounts runs an expert advisor on a meaningful share of trades, and removing them moves the figure from 42.2% to 41.3%.
It is not one trading style. AUDCAD returns 42.4% among day traders and 42.5% among swing traders. Every other instrument we measured shows a wide gap between those two groups. AUDCAD shows none.
It is not simply low volatility. AUDCAD is calm in absolute terms, with an average daily range around 0.66% of price against roughly 1.26% for NAS100 and 2.38% for gold. But measured over ten years its annualized volatility is 7.05%, almost identical to EURUSD's 7.12%. Two pairs, near-identical volatility, and a 23 point gap in profit rate. Volatility on its own cannot be the explanation.
What separates AUDCAD is not how much it moves. It is that the movement goes nowhere, it's very much range trading.
Over the ten years to July 2026, AUDCAD spent 93.3% of all trading days between 0.85 and 1.00. Its entire ten-year range spans about 21% of its median price, and 98% of days fell within 10% of that median. Extend the window to twenty years and it still held the same band on roughly four days in five.
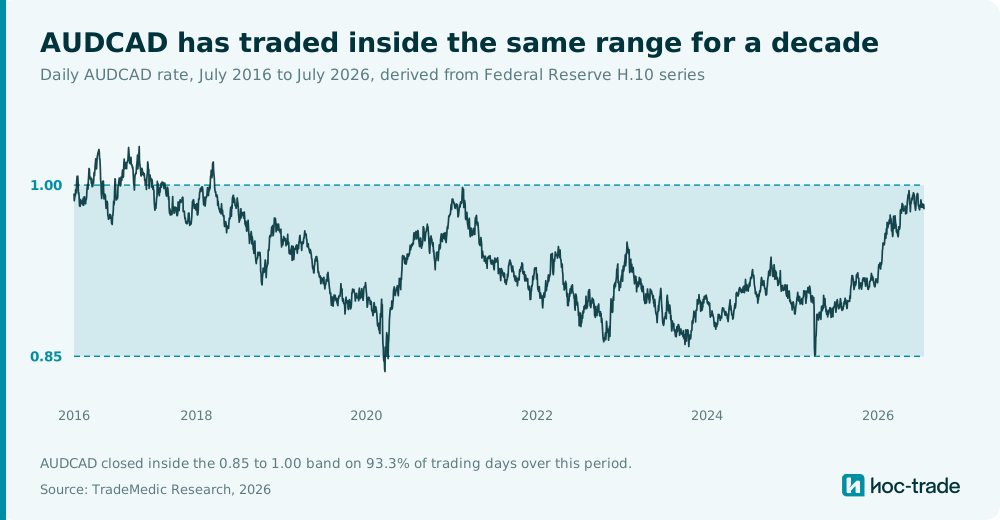
A formal test confirms the impression. A variance ratio compares how far a market travels over long horizons against how far its daily volatility suggests it should. A reading of 1.0 describes a random walk. AUDCAD's sixty-day variance ratio over the last decade is 0.67, meaning two-month moves carry only about two thirds of the variance a random walk would produce. EURUSD over the same period reads 1.05. AUDCAD's reading stays below 1.0 in every sub-period we tested back to 2006, and it falls further as the horizon lengthens, reaching 0.58 at 120 days. The implied mean-reversion half-life is roughly 127 days.
The structural reason is that the Australian and Canadian dollars are both commodity currencies attached to resource-export economies with broadly similar rate cycles. Because both sides respond to the same global impulses, the cross nets out much of what would move either one against the US dollar.
One limitation belongs here rather than in a footnote. Profit rate measures how many accounts finish net positive and says nothing about the size of wins and losses. A tight, mean-reverting market is precisely the type that can produce many small winners alongside rare large losers, and we have not published magnitude figures for this group. Read the AUDCAD result as evidence that range-bound markets suit how retail traders behave, not as a recommendation to move your account.
Low volatility currency pairs: why they suit retail traders
Low volatility currency pairs suit retail traders because the way they move forgives the way most people trade. The AUDCAD finding points at something broader than one cross.
Retail traders are, in aggregate, impatient. They hold for hours rather than days, they add to losers, and they exit winners early. A market that trends hard punishes all three at once, because trends reward patience and conviction. A market that oscillates forgives them, because a badly timed entry in a range often becomes a good one if you wait. Our data shows, successful low volatility trading is one of the strongest markers for an overall profitable trader.
Low volatility pairs also lower the cost of a sizing mistake. Carrying the wrong lot size through a 0.66% daily range is survivable. Carrying the same mistake through gold's 2.38% frequently is not.
The caveat runs the other way too. Relative to a 0.66% daily range, a typical AUDCAD spread consumes a larger share of available movement than a gold spread does of gold's range. Range-bound pairs are not cheap in relative terms. They happen to suit the holding periods that produce better outcomes.
That cost matters far more the faster you trade, and it shows up starkly in the scalper numbers. Scalpers on EURUSD and GBPUSD combined finish net profitable at just 7.1%, against 20.2% for scalpers on gold. The reason is spread relative to range. On a standard account a EURUSD spread eats roughly 2.1% of a full day's range, while a gold spread eats about 0.4% of gold's. A scalper closes many small positions and each one has to clear the spread before it profits, so the major-pair scalper is paying a far larger share of the available move on every entry. A patient trader holding for days barely notices that spread. A scalper trying to skim a fraction of the daily range is fighting it on every trade. This is why the majors, which reward patience, punish speed so heavily, and why almost nobody who scalps currency pairs makes money doing it.
EURUSD vs GBPUSD: which performs better?
GBPUSD leads at 20.4% against EURUSD at 19.2%, a gap of roughly one point.
We would not encourage anyone to switch on the strength of that. Across groups this large, a single point is a curiosity rather than a finding. What matters is that both sit above the population baseline and above gold, crypto, and every index we measured.
The reasons are unglamorous and probably correct. Major pairs carry the tightest spreads available to retail traders, which lowers the bar every trade has to clear. Their daily ranges are narrow enough that sizing errors are rarely immediately fatal. And their sessions are well defined, so a trader who wants to be flat overnight can be.
Best forex pairs for beginners
The best forex pairs for beginners are the majors, EURUSD and GBPUSD, which carry the tightest spreads and both finish above the population baseline. The conventional advice to start on EURUSD holds up in the data, and it adds one thing.
New traders gravitate toward whatever moves most, because movement looks like opportunity. In this dataset that means gold at 17.7%, NAS100 at 11.1%, and BTCUSD at 14.0%, all three below the 18.2% baseline. The instruments that feel most alive on a chart are the ones where beginners fare worst.
If you are starting out, the useful reframing is that a slower instrument is not a less serious one. The population data says the opposite.
Best market to trade: how forex compares to gold, indices, and crypto
The best market to trade, on this evidence, is forex: currency pairs occupy the top of the table while indices and crypto occupy the bottom. Gold, chosen as the main instrument by 65.9% of traders, sits fractionally below the population average at 17.7%.
The index result is the one most likely to surprise people, and we have covered it in depth in our comparison of forex vs indices, where index traders finish net profitable at 12.3% against 19.6% for major currency pair traders. Gold's position, and the reason its outcome depends so heavily on holding period, is covered in our analysis of the best timeframe to trade gold.
Best currency pairs for swing trading and day trading
For swing trading, EURUSD and GBPUSD lead the majors at 30.8% and 28.1%; for day trading, AUDCAD is far ahead and the majors sit near 18%. Because day traders make up the large majority of accounts, the overall ranking is effectively the day trader ranking, and looking at swing traders separately raises every rate but changes the order very little.
Among day traders, AUDCAD returns 42.4%, GBPUSD 18.9%, EURUSD 17.5%, gold 17.3%, and NAS100 10.7%. Among swing traders the same instruments return 42.5%, 28.1%, 30.8%, 21.0%, and 26.0%.
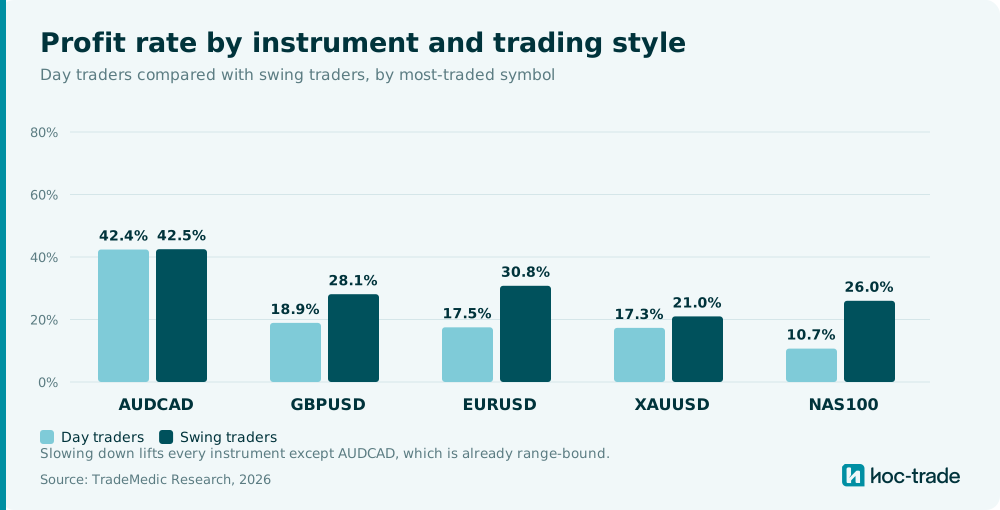
For swing trading the major pairs are the standouts, with EURUSD at 30.8% the highest rate of any style and instrument combination outside AUDCAD. For day trading the majors hold a smaller advantage over gold, and AUDCAD remains far ahead.
The pattern worth noticing is how differently each instrument responds to slowing down. Moving from day trading to swing trading roughly doubles the rate on NAS100 and lifts EURUSD by around three quarters. On gold it adds about a fifth. On AUDCAD it changes nothing, because the pair is already calm enough that holding longer adds little. Our wider analysis of day trading versus swing trading covers the style question across the full dataset, where swing traders finish net profitable at 27.5% against 17.3% for day traders.
Does the pair you trade matter more than how you trade it?
It matters. It does not matter most.
Setting AUDCAD aside, the spread across instruments runs from about 11% to about 20%. Within the same dataset, accounts risking under 0.5% per trade finish profitable at roughly double the rate of those risking 2% to 5%, and accounts operating above a 2.0 reward-to-risk ratio finish profitable at more than four times the rate of those below 0.5.
Pair selection belongs in the same tier as how much you risk per trade. Worth getting right, capable of costing several points of probability, and less powerful than what you do once a position is open.
How TradeMedic™ AI analyzes instrument performance
Population averages describe traders in general. They cannot tell you which pair suits you.
TradeMedic™ AI connects to your MT4 or MT5 account and analyzes your real trade history across 60+ behavioral patterns, quantifying each in dollars against your own results. Two of them address instrument choice directly.
Symbol Expert tests whether you consistently outperform on a specific instrument over time rather than simply trading it most often. Familiarity feels like skill from the inside, and this pattern separates the two.
Symbol Focus examines how many instruments you hold open at once and whether your results improve when that number falls. Concentration and expertise are different things, and the report measures them separately. Our analysis of how many pairs you should trade covers what the data shows about concentration and where the only real edge appears.
Every pattern is benchmarked against the wider population, so you see both what your own history says and how it compares to traders in similar circumstances.
The bottom line
Among the currency pairs in this study AUDCAD returns the highest profit rate at 42.2%, followed by GBPUSD at 20.4% and EURUSD at 19.2%, against a population baseline of 18.2%. Widening the frame, currency pairs outperform gold, indices, and crypto, and NAS100 sits last at 11.1%.
The AUDCAD result appears to come from the pair being strongly range-bound rather than from anything its traders do differently. It held the same 0.85 to 1.00 band on 93.3% of days over the last decade, and a sixty-day variance ratio of 0.67 confirms mean reversion rather than a random walk.
The wider lesson is more useful than any single pair. Calm, oscillating markets appear to suit how retail traders behave, while fast, trending ones expose the habits that cost people money.
Learn more about TradeMedic™ AI
Connect your trading account to TradeMedic™ AI free
Methodology
Traders are grouped by their most-traded instrument, defined as the single symbol in which the account placed the highest number of trades. No minimum concentration threshold is applied, so groups include both focused specialists and traders who spread activity widely. Profit rate means the share of accounts in a group that finished net profitable across their analyzed history. Trading style is derived from observed holding periods and trade frequency. Average daily range figures are drawn from Barchart as of July 26, 2026, using the 50-day window. Spread-to-range figures use typical broker standard commission-free account spreads as of 2026 expressed against the same Barchart daily ranges. AUDCAD and EURUSD ten-year volatility, trading-band, and variance-ratio figures are computed from Federal Reserve H.10 daily exchange rate series (DEXUSAL and DEXCAUS) for the ten years to July 2026. Groups representing very small trader populations are excluded from published rankings.
Source: TradeMedic Research, 2026
Frequently asked questions
What is the best forex pair to trade?
Across 500,000+ trading accounts, AUDCAD produces the highest profit rate at 42.2%, followed by GBPUSD at 20.4% and EURUSD at 19.2%, against a population baseline of 18.2%. AUDCAD's result appears to come from the pair being strongly range-bound rather than from trader skill.
Which is the most profitable forex pair?
AUDCAD, at 42.2%, more than double the 18.2% population baseline. The result holds after excluding automated trading accounts and appears at nearly identical levels among both day traders and swing traders.
Is EURUSD or GBPUSD better to trade?
GBPUSD traders finish net profitable at 20.4% and EURUSD traders at 19.2%. The one-point difference is small across groups this size. Both sit above the 18.2% population baseline and above gold, crypto and every index measured.
What are the best forex pairs for beginners?
Major pairs such as EURUSD and GBPUSD carry the tightest spreads and narrower daily ranges, and both outperform the population baseline. Beginners often gravitate instead toward gold at 17.7%, NAS100 at 11.1% and BTCUSD at 14.0%, all of which sit below it.
Why are forex scalpers so unprofitable?
Scalpers on EURUSD and GBPUSD combined finish net profitable at just 7.1%, against 20.2% for gold scalpers. On a standard account a EURUSD spread consumes roughly 2.1% of a full day's range while a gold spread consumes about 0.4% of gold's, so a currency-pair scalper pays a far larger share of the available move on every trade.
Why is AUDCAD more profitable than other currency pairs?
AUDCAD is strongly range-bound. It spent 93.3% of the last ten years between 0.85 and 1.00, and its sixty-day variance ratio of 0.67 indicates mean reversion rather than a random walk. Both the Australian and Canadian dollars are commodity currencies responding to similar global drivers, which suppresses movement in the cross.
Does the currency pair you trade matter more than how you trade it?
No. Excluding AUDCAD, profit rates across instruments span roughly 11% to 20%. Within the same dataset, reward-to-risk ratio and position sizing each produce wider spreads. Pair selection is worth several percentage points of probability, while trade management is worth more.