Category:
 Author:
 Date:Aug 6, 2026
The Average Retail Trading Account Lives About 100 Days. Better Feedback Adds 40 to 45 of Them.
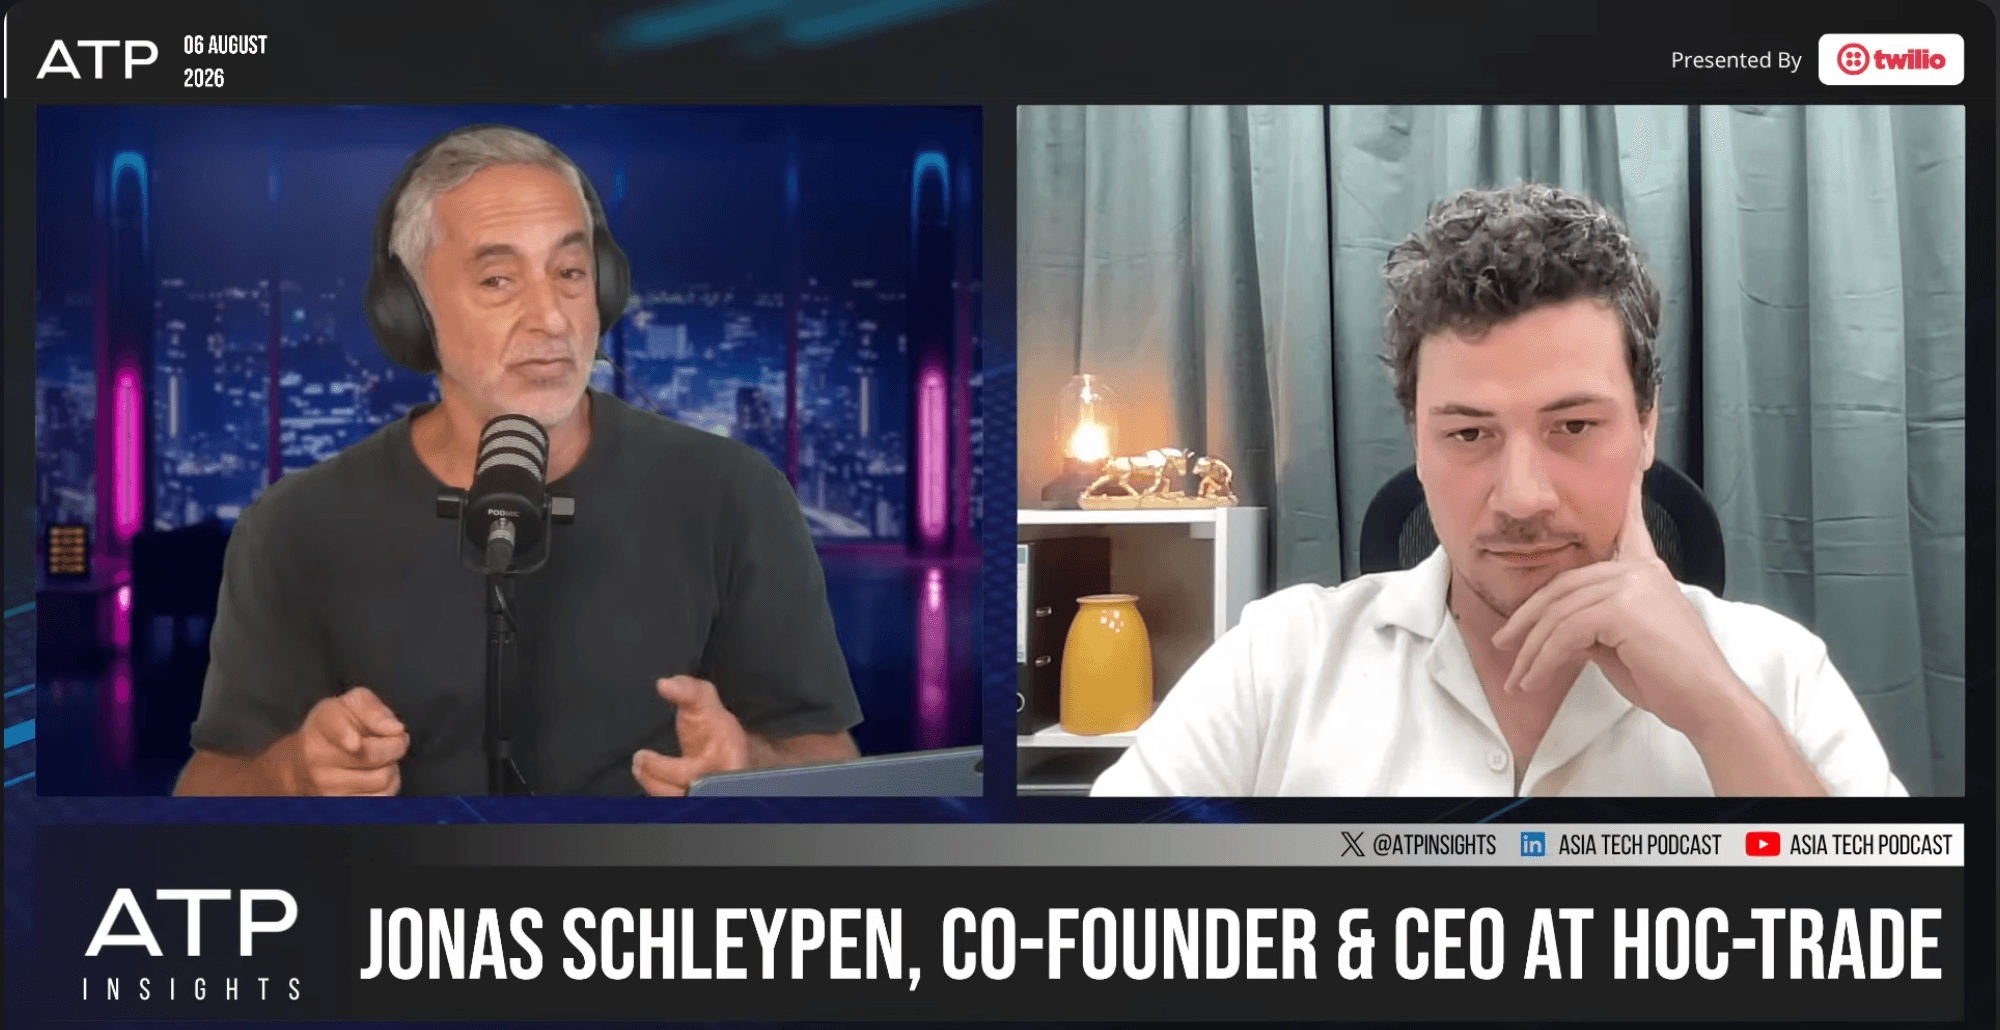
Michael Waitze spent more than twenty years on trading desks at Citigroup, Morgan Stanley and Goldman Sachs before he started interviewing founders for the Asia Tech Podcast. When our CEO Jonas Schleypen joined him on ATP Insights, the first thing Michael pushed back on was the assumption that a trader needs more information. He described sitting on a desk with a fire hose of data pointed at him, and said the last thing he wanted was another feed. That objection is the right place to start, because it explains why so much of what gets sold to traders in the name of help does not help.
The number that reframes the conversation is trader lifetime. Across the 500,000+ trader accounts analysed by TradeMedic AI, the average retail account is active for roughly 100 days from first trade to last. More than 80% of retail traders lose money. Traders who received behavioural analysis stayed active around 40 to 45 days longer, and their average trading volume rose 32%. Those last two numbers get read as retention metrics, and they are, but they are downstream of something simpler. Traders did not stay longer because anyone retained them. They stayed longer because they stopped emptying the account so quickly.
How long does the average retail trading account stay active?
Roughly 100 days, measured from a trader’s first action on the account to their last. That figure surprises most people who work in the industry, including people who have traded professionally for decades.
It varies by style. Scalpers in our data average around 41 trades a day, which compresses the timeline considerably. Overtrading is one of the most common patterns we find, and transaction costs sit on top of whatever the trading itself does to the balance.
The account rarely dies because the trader lost interest. It dies because the trader lost money faster than they learned anything from losing it. Nothing in the standard retail setup closes that loop. You get charts, signals, execution and a statement, and none of them tell you why last month went the way it did.
Why doesn’t more market data help traders stay longer?
There are already more than enough tools analysing the market. Signals, scanners, news feeds, indicators, sentiment overlays. A retail trader can receive hundreds of notifications in a day for a single asset, and thousands across an asset class. Adding one more input to a saturated attention budget does not change outcomes.
The side that stays unexamined is the trader. TradeMedic AI does not analyse the market and tell you how the market is behaving. It analyses you. The output is closer to: in situations where I enter a trade within ten minutes of a loss, I severely underperform, I size up, and I react on gut feeling instead of sticking to my plan.
It is also deliberately not a live overlay. The analysis arrives as a document, something closer to a trading journal you review for fifteen minutes a day, and it points at where profits are leaking. Trading is complex enough already. The design constraint is to make the trader better without making their screen busier.
What data does behavioural trading analysis need?
Less than people expect. TradeMedic AI connects to platforms such as MetaTrader 4 and MetaTrader 5 in anonymised form and reads what is already sitting in the trading record: symbols, timestamps, position sizes, profits and losses. Alongside that it pulls quotes and news for the markets the trader is active in, so it can tell whether a given entry was a reaction to a typical news event.
The most valuable input is history. That is where repeated behaviour lives, and where you can see whether a trader is currently breaking their own pattern or repeating it.
There is no heart rate monitor and no wearable. It would be reasonable to assume you need biometric data to detect emotional trading, but combining the raw trade record with market context already tells you whether someone is trading a breakout or following a trend, and whether the last loss changed how they sized the next position. The behaviour is in the data.
Why does putting a dollar figure on a pattern change behaviour?
Experienced traders do not react to the report by saying they had no idea they were revenge trading or cutting winners too early. They know. This is often framed as a discipline problem, and discipline is part of it. But there is more going on.
The gap is not awareness, it is quantification. Very few traders have ever been shown the exact dollar figure a habit has cost them, attributed trade by trade. That is what makes it real. Each trade is marked as fitting the pattern or not, with the impact attached, and experienced traders tend to like data and like tracing individual steps. Once they can see it broken down at that level, an actual review process starts and the adjustments follow.
Behavioural finance has understood this territory for a long time. Prospect theory, which describes why losses feel heavier than equivalent gains and why people take bad risks to avoid booking one, won Daniel Kahneman the Nobel Prize in Economic Sciences in 2002, and loss aversion is the reason so many traders hold a losing position and close a winning one. What has been missing is not the theory. It is any way for an individual trader to see the theory operating in their own account, with their own numbers attached.
What does a trader actually get out of it?
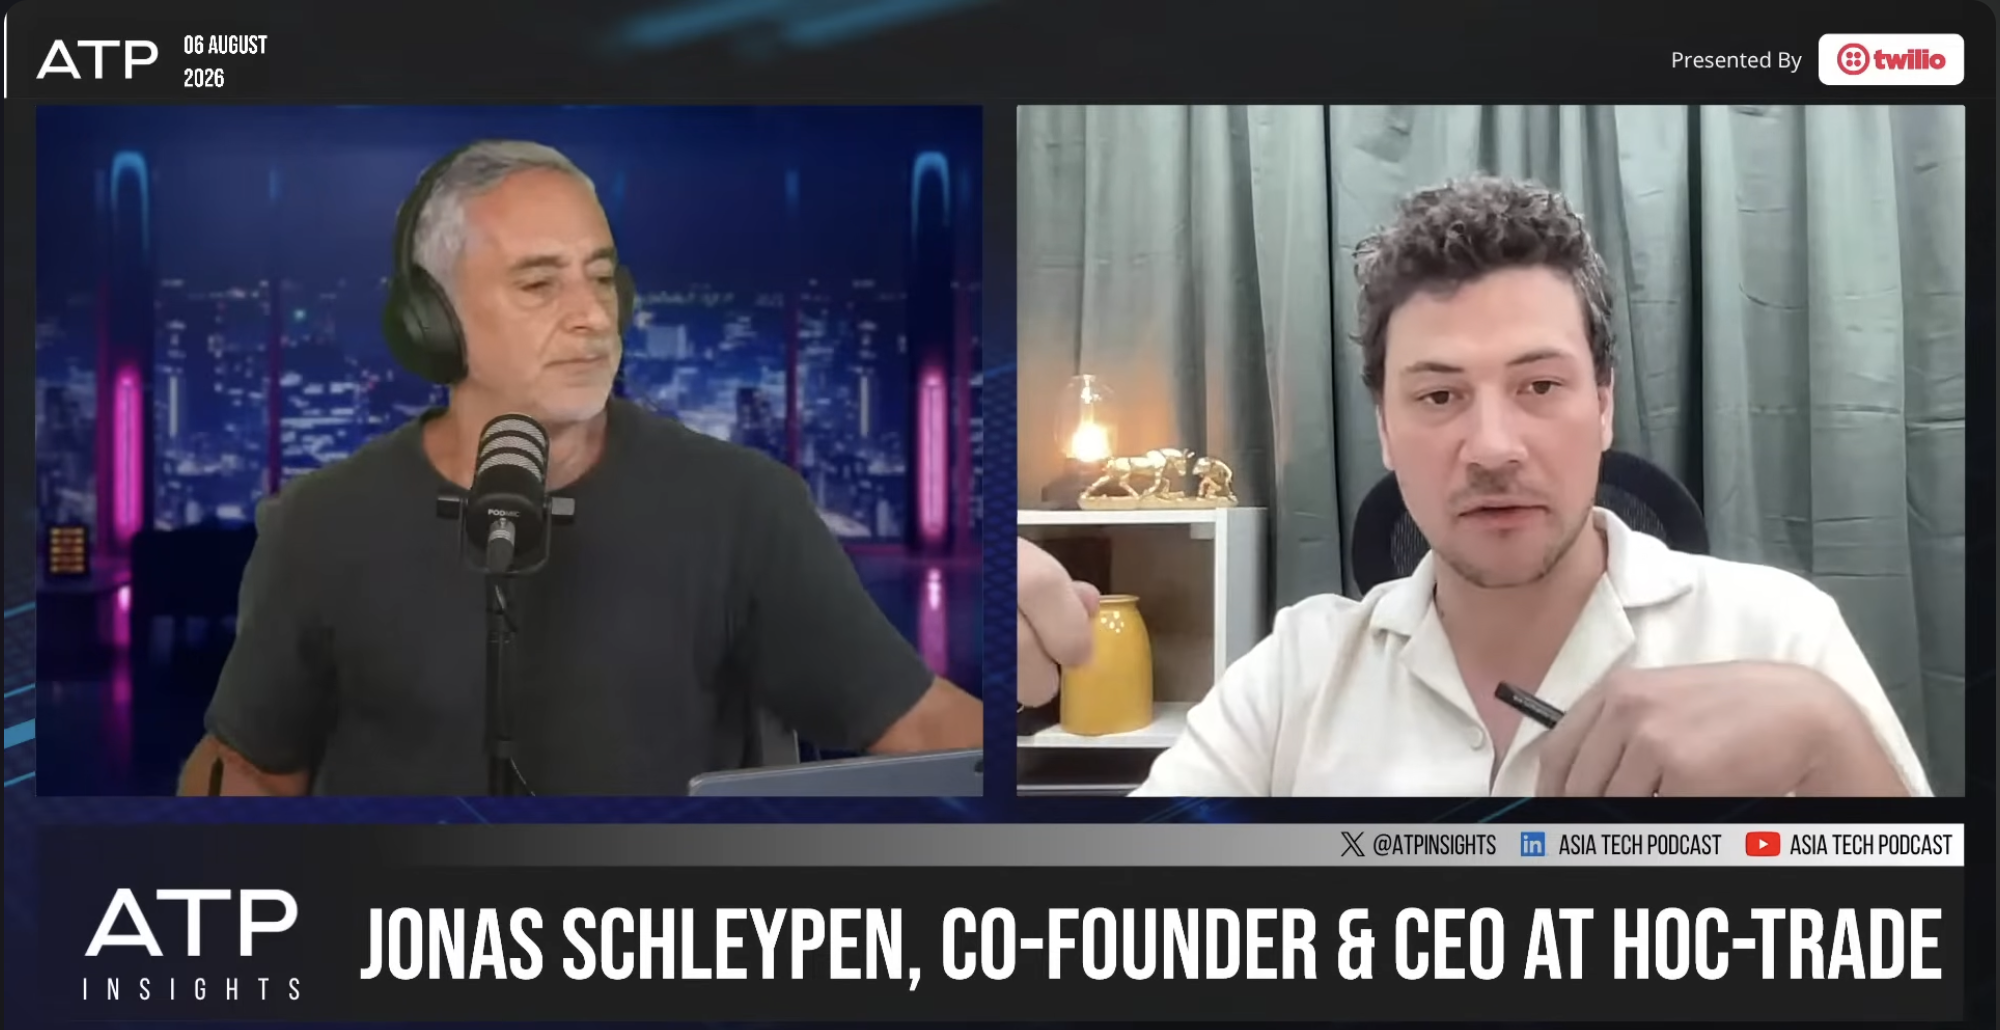
Michael made a second point during the conversation that matters as much as the first one. Traders, in his experience, do not like being told what to do. That is accurate, and a tool built to issue instructions to traders would fail on contact.
So the report does not issue instructions. It presents evidence and leaves the conclusion to the trader. Every claim is traceable to specific trades in their own history, with trade IDs, dates, instruments and the profit or loss attached, which means nothing has to be taken on faith. A trader who disagrees with a finding can go and check it. That is a different relationship than being handed a signal and told to follow it.
The report also leads with strengths rather than only with what is going wrong. Most feedback a retail trader encounters is punitive: the balance drops, the margin call arrives, the forum tells them they are undisciplined. Identifying what a trader already does well and how much it earns them is not a softening device. Increasing what works is often easier than removing an ingrained habit, and a document a trader finds worth opening again next week is a document that can change something. One that reads as an indictment gets closed.
The underlying point is that the trader keeps the decisions. The analysis makes the consequences of their own patterns visible in a form they can act on, and then gets out of the way.
You can learn more about TradeMedic™ AI here or connect your account free and see your own personal report.
How do you measure whether behavioural feedback actually works?
Michael raised the obvious objection, and it is the correct one: hindsight is cheap. Anyone can look back at their own history and calculate what they would have made if they had skipped their worst decisions.
So the measurement runs forward. TradeMedic AI takes a snapshot of the trader’s detected patterns at a point in time, then tracks live trades from that point on. For each new trade the question is whether it would have been screened out for falling into a known loss-making pattern, or whether the position would have been better at half the size. Because the patterns were fixed before those trades existed, the comparison against actual performance is like for like, with nothing borrowed from knowing how it turned out.
Our published effectiveness study was built on the same principle. The AI sorted every trade at the moment it was opened, with no knowledge of how it would turn out, into trades carrying behavioural issues and trades that did not. Across 2.75 million trades from 6,500 traders using real money, the clean trades performed 63% better on average. The classification is a genuine prediction rather than a retrospective label, which is the part that makes the number mean something.
The rest of that result is the part worth reading carefully. Both groups still lost money. Trades flagged with behavioural issues averaged a loss of 1.15% of account balance. Trades without issues averaged a loss of 0.43%. Removing the behavioural component does not convert a losing trader into a winning one. It removes roughly two thirds of the damage, which is a large effect and still not the whole problem, partly because trading fees work against every transaction and partly because the study only counted behaviours detectable at entry. Cutting profits too early and failing to cut losses are both real and both invisible at the moment a trade opens, so neither is in that number.
Why does this show up in retention and volume?
Most of our clients are brokerages and exchanges rather than individual traders, and they typically offer the analysis to their client base for example as a VIP tool. That is the layer where the effect gets measured. Traders using it stay active roughly 40 to 45 days longer against an average account life of about 100 days, and average trading volume rises 32%.
It is worth being precise about the direction of that causation, because the numbers are easy to misread. A trader does not last longer because a retention programme reached them. They last longer because the account is not being drained as fast, which is the same thing as saying they are trading better. For a broker whose revenue comes from an active, returning client base, that is one of the few places where doing something genuinely useful for the trader and improving the commercial numbers turn out to be the same action.
Performance improves too, and here the honest answer matters more than the flattering one. On a relative basis the average trader gets meaningfully better. They do not reach break-even though, on average. Some traders who were only slightly loss-making cross into break-even or profit, but averaged across everyone who has used the tool, the trader is still losing. The uncomfortable truth of retail trading is that the majority lose money, and no single tool erases that. We are not good enough yet. There is a great deal still to improve, and we would rather say so than publish a number that does not survive contact with a broker’s own reporting.
What comes after the report?
Half a million analysed traders is a solid base to train on, and it opens two directions. The first is going deeper into the market side, reading what is happening in the market and joining it to the behavioural profile rather than treating the two separately.
The second is a small number of live features, built against Michael’s objection rather than in spite of it. Not more notifications for their own sake. The kind of message that earns its place is specific to the trader and to the moment: you have just reached your typical daily trade count, and past this point your performance has historically dropped. Or: you have just taken a loss, and your typical recovery window before you trade rationally again is about the next twelve minutes, so either set a limit order or stay out until it passes. A helper on the side, not another feed, and still a suggestion rather than an instruction.
What does the data behind this look like?
TradeMedic AI has analysed more than 500,000 trader accounts, and the detection algorithms are trained on that base. Every pattern the system identifies is quantified in dollars for that individual trader, ranked by the size of its effect on their performance, and evidenced with the specific trades that demonstrate it. Overtrading ranks among the most common patterns in the dataset. Population-level benchmarks like the 100-day average account life and the 41 trades a day scalper average come from the same source. More detail on the research programme is available on our research page. Source: TradeMedic Research, 2026.
Where this leaves brokers and traders
For a broker, the question is not whether their traders behave in ways that cost them money. They do, and it is repetitive enough to be measured. The question is whether anything currently in the stack tells the trader so in terms they will act on, and whether the answer to a 100-day average account life is another acquisition campaign or a client who lasts.
For a trader, the question is narrower and more useful. You already have the data. Every entry, exit, size and result is sitting in your account history, and the pattern that is costing you the most is somewhere in it with a number attached. You can connect your trading account to TradeMedic AI for free and see what it says, or read more about how the analysis works first. Brokers evaluating this for their own client base can look at the partnership options.
The full conversation with Michael Waitze is on the Asia Tech Podcast, in the ATP Insights episode, and Jonas’s segment starts at 1:44:43.
Frequently asked questions
How long does the average retail trading account stay active?
Across the 500,000+ trader accounts analysed by TradeMedic AI, the average retail trading account is active for roughly 100 days from first trade to last. This varies by trading style, with scalpers averaging around 41 trades a day. More than 80% of retail traders lose money over their trading lifetime.
What does a trader get out of behavioural trading analysis?
A trader gets a quantified account of their own repeated behaviour, built from their own trade history rather than from generic advice. Each detected pattern carries a dollar figure and is evidenced with the specific trades that demonstrate it, so the trader can verify every claim against their own record. The report also identifies strengths, because increasing what already works is often easier than removing an ingrained habit.
Does behavioural analysis make retail traders profitable?
It improves average performance but does not make the average trader profitable. Some traders who were slightly loss-making move into break-even or profit, but taken across everyone who has used the tool, the average trader does not reach break-even. The effects that hold consistently are retention and volume: traders stay active roughly 40 to 45 days longer and trade around 32% more.
What data does behavioural trading analysis require?
TradeMedic AI connects to platforms such as MetaTrader 4 and MetaTrader 5 in anonymised form and reads what is already in the trading record: symbols, timestamps, position sizes, and profits and losses. It pulls quotes and news for the markets the trader is active in, so it can tell whether a trade was a reaction to an event. No biometric data is used.
How do you prove behavioural feedback works rather than just looking good in hindsight?
Effectiveness is measured forward, not backward. TradeMedic AI takes a snapshot of a trader’s detected patterns at a point in time, then tracks live trades from that point on and simulates what would have happened if flagged trades had been screened out or sized down. Because the patterns were fixed before the trades happened, the comparison against actual performance is like for like.
How much better do trades perform without behavioural issues?
In hoc-trade’s effectiveness study, trades classified as free of behavioural issues at the point of entry performed 63% better on average than trades carrying them. The study covered 2.75 million trades from 6,500 traders using real funds. Both groups still lost money on average, at 0.43% of balance for clean trades against 1.15% for flagged trades, so the effect removes roughly two thirds of the damage rather than producing profitability.