Category:
 Author:
 Date:Nov 15, 2026
The Martingale Strategy: Why Winning 99.8% of the Time Still Breaks the Account
The martingale strategy promises something no other trading plan does: you never need to be right about the market. Double your position after every losing trade, and the first win pays back every loss before it, plus a small profit.
We ran the maths on a forex version of it and compared it with what TradeMedic AI sees in 500,000+ trading accounts. Martingale does not change the odds of a trading strategy. It changes their shape: it turns a normal mix of wins and losses into hundreds of tiny wins and one loss big enough to break the account. And the habit at its core, adding to losing positions, is the most expensive pattern in our data.
What is the martingale strategy?
The martingale strategy is a position-sizing rule: after every losing trade, you double the size of the next one, and after a win you go back to the starting size. TradeMedic AI does not look for the name "martingale", but it measures the two habits the strategy is built on: raising risk after losses and adding to losing positions.
The rule is older than modern markets. It began as a betting system, and traders later borrowed it for sizing positions. In trading it shows up in two forms. In the classic form, each new trade after a loss is twice as big as the last. In the grid form, common in forex robots, a position that moves against you gets a new, larger position added at fixed distances until the price turns. Both rest on the same promise: one good move pays for everything.
How does the martingale strategy work in forex?
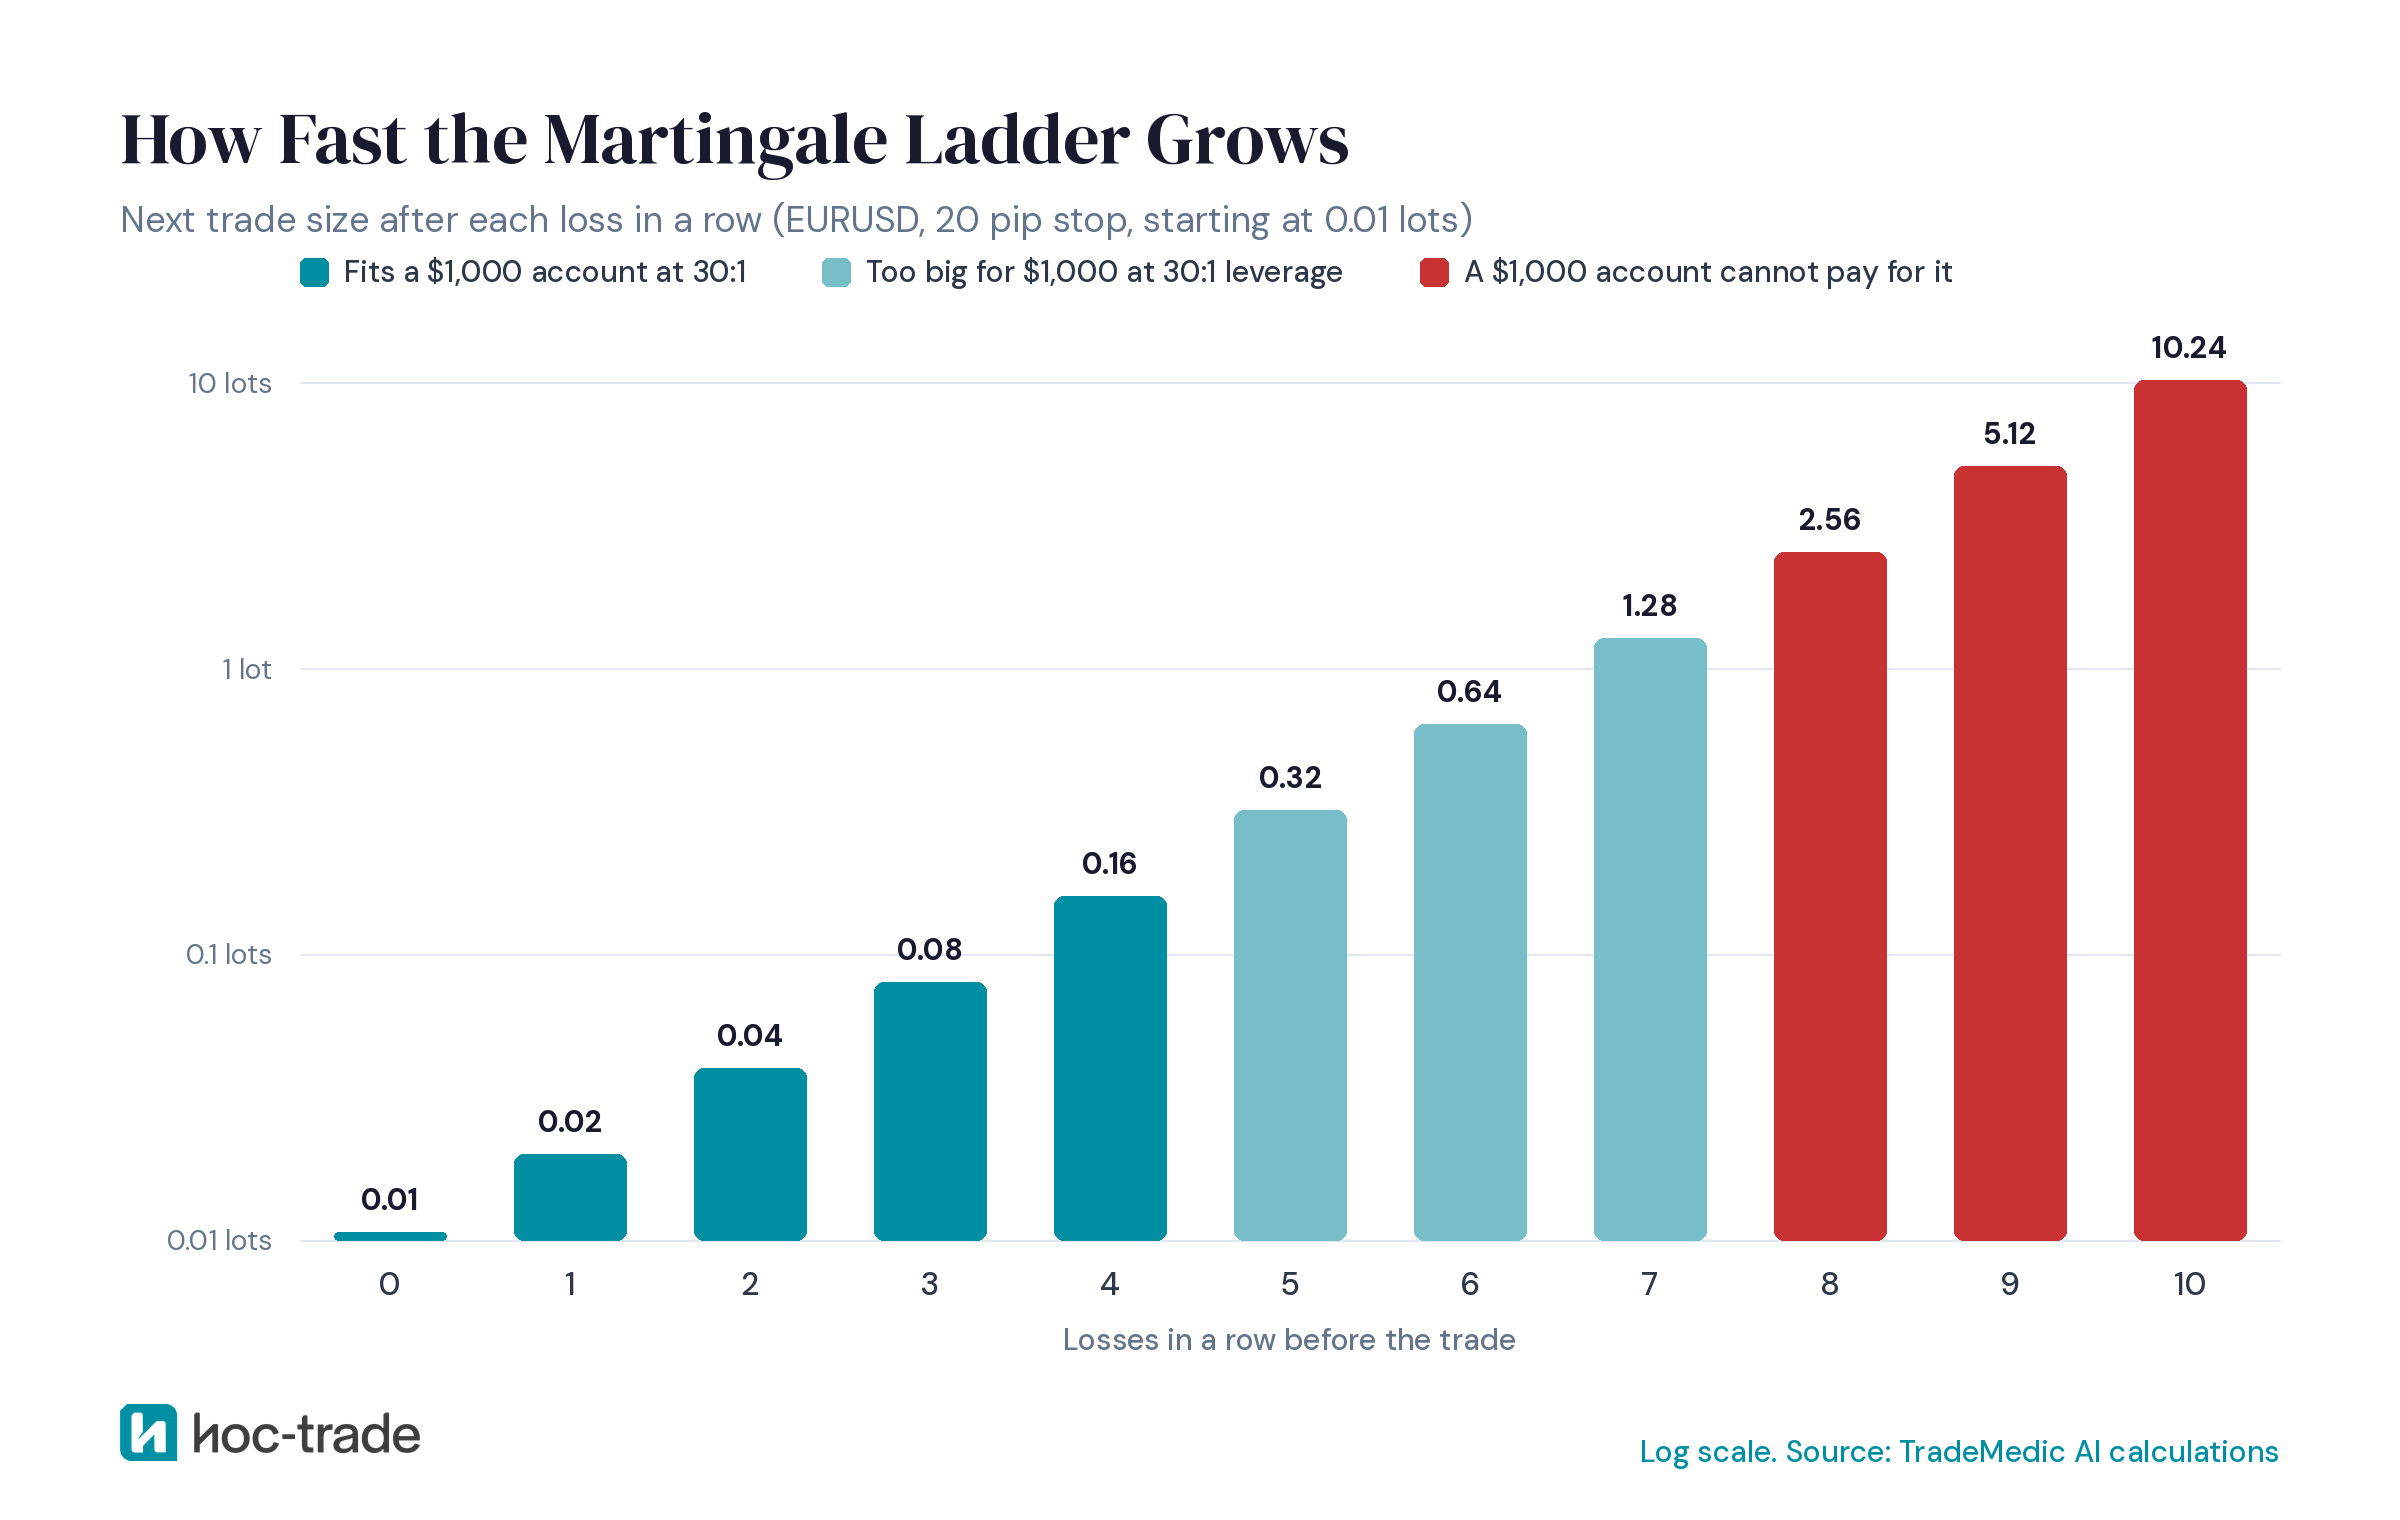
Here is the classic version on EURUSD, with every trade risking 20 pips to make 20 pips. The first trade is 0.01 lots, so it risks $2. Each loss doubles the next trade:
After 1 loss, the next trade is 0.02 lots and risks $4.
After 5 losses in a row, it is 0.32 lots and risks $64, with $62 already lost.
After 8 losses in a row, it is 2.56 lots and risks $512, with $510 already lost.
After 10 losses in a row, it is 10.24 lots and risks $2,048 to win back $2,046.
Whenever the winning trade comes, it pays back every loss in the run plus $2, the profit of one starting trade. That is the whole reward: one starting stake per completed run, however long the run was and however much it put at risk on the way.
Does the martingale strategy work?
Most of the time it does, and that is exactly the problem. Take a $1,000 account using the ladder above. A fresh $1,000 account runs out after 8 losses in a row, because the next doubled trade would cost more than it has left; after its first $22 of profit, it can pay for a ninth. From then on, a run only fails at 9 losses in a row, which at a 50% win rate happens in about 1 run in 512.
A 50% win rate on a 1:1 trade already needs an edge. With a spread of about 1 pip, a 20 pip target and a 20 pip stop need roughly 52% wins just to break even, and positions held overnight pay swap on top. So the figures below are a best case before costs.
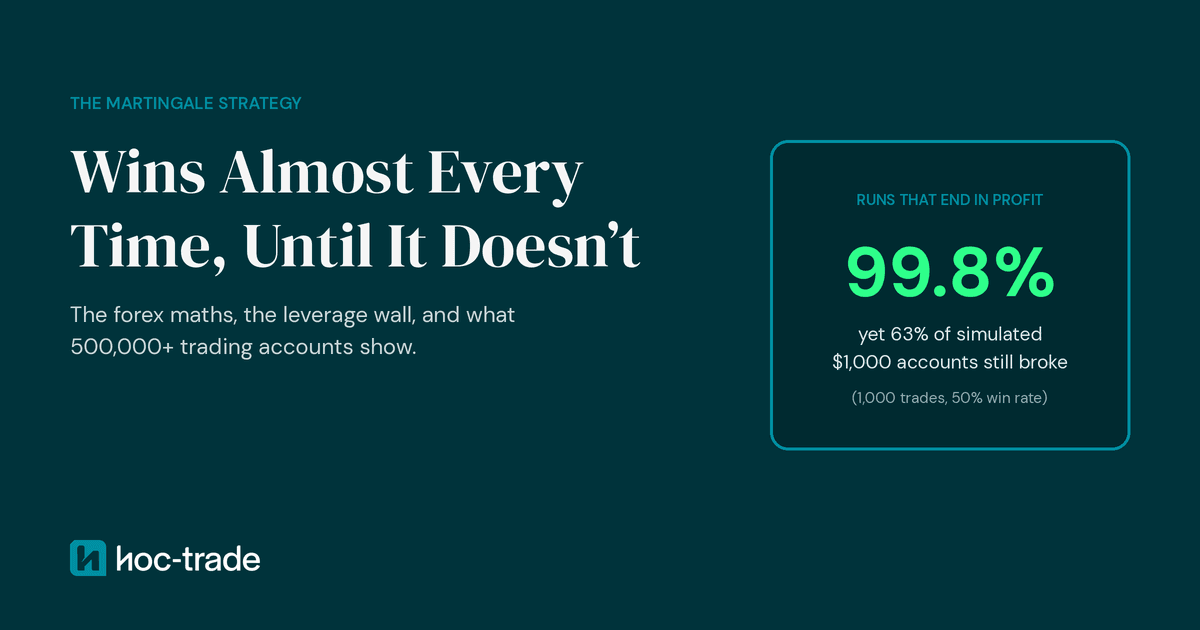
At a 50% win rate, 99.8% of martingale runs end in a small profit.
Over 1,000 trades, the chance of meeting at least one run of 9 losses in a row is about 62%.
In 50,000 simulated $1,000 accounts trading 1,000 times each, 63% met that streak. When they did, the median account had grown to about $1,368 first and was left with about $408.
The 37% that never met the streak finished near $2,000.
Averaged over all 50,000 accounts, the result was about $1,000, the same as the start. Martingale added no edge. It only moved the outcomes around: steady small gains for most of the way, then a single run that took more than half the account. Add trading costs and it turns negative. At a 48% win rate, closer to what a 1:1 coin flip looks like after spreads, 74% of the simulated accounts met the streak and the average ended at about $786.
The simulation assumed a win rate. Yours is in your trade history. TradeMedic AI shows your real win rate, your average win against your average loss, and whether your trades get bigger after a run of losses.
Check your own numbers free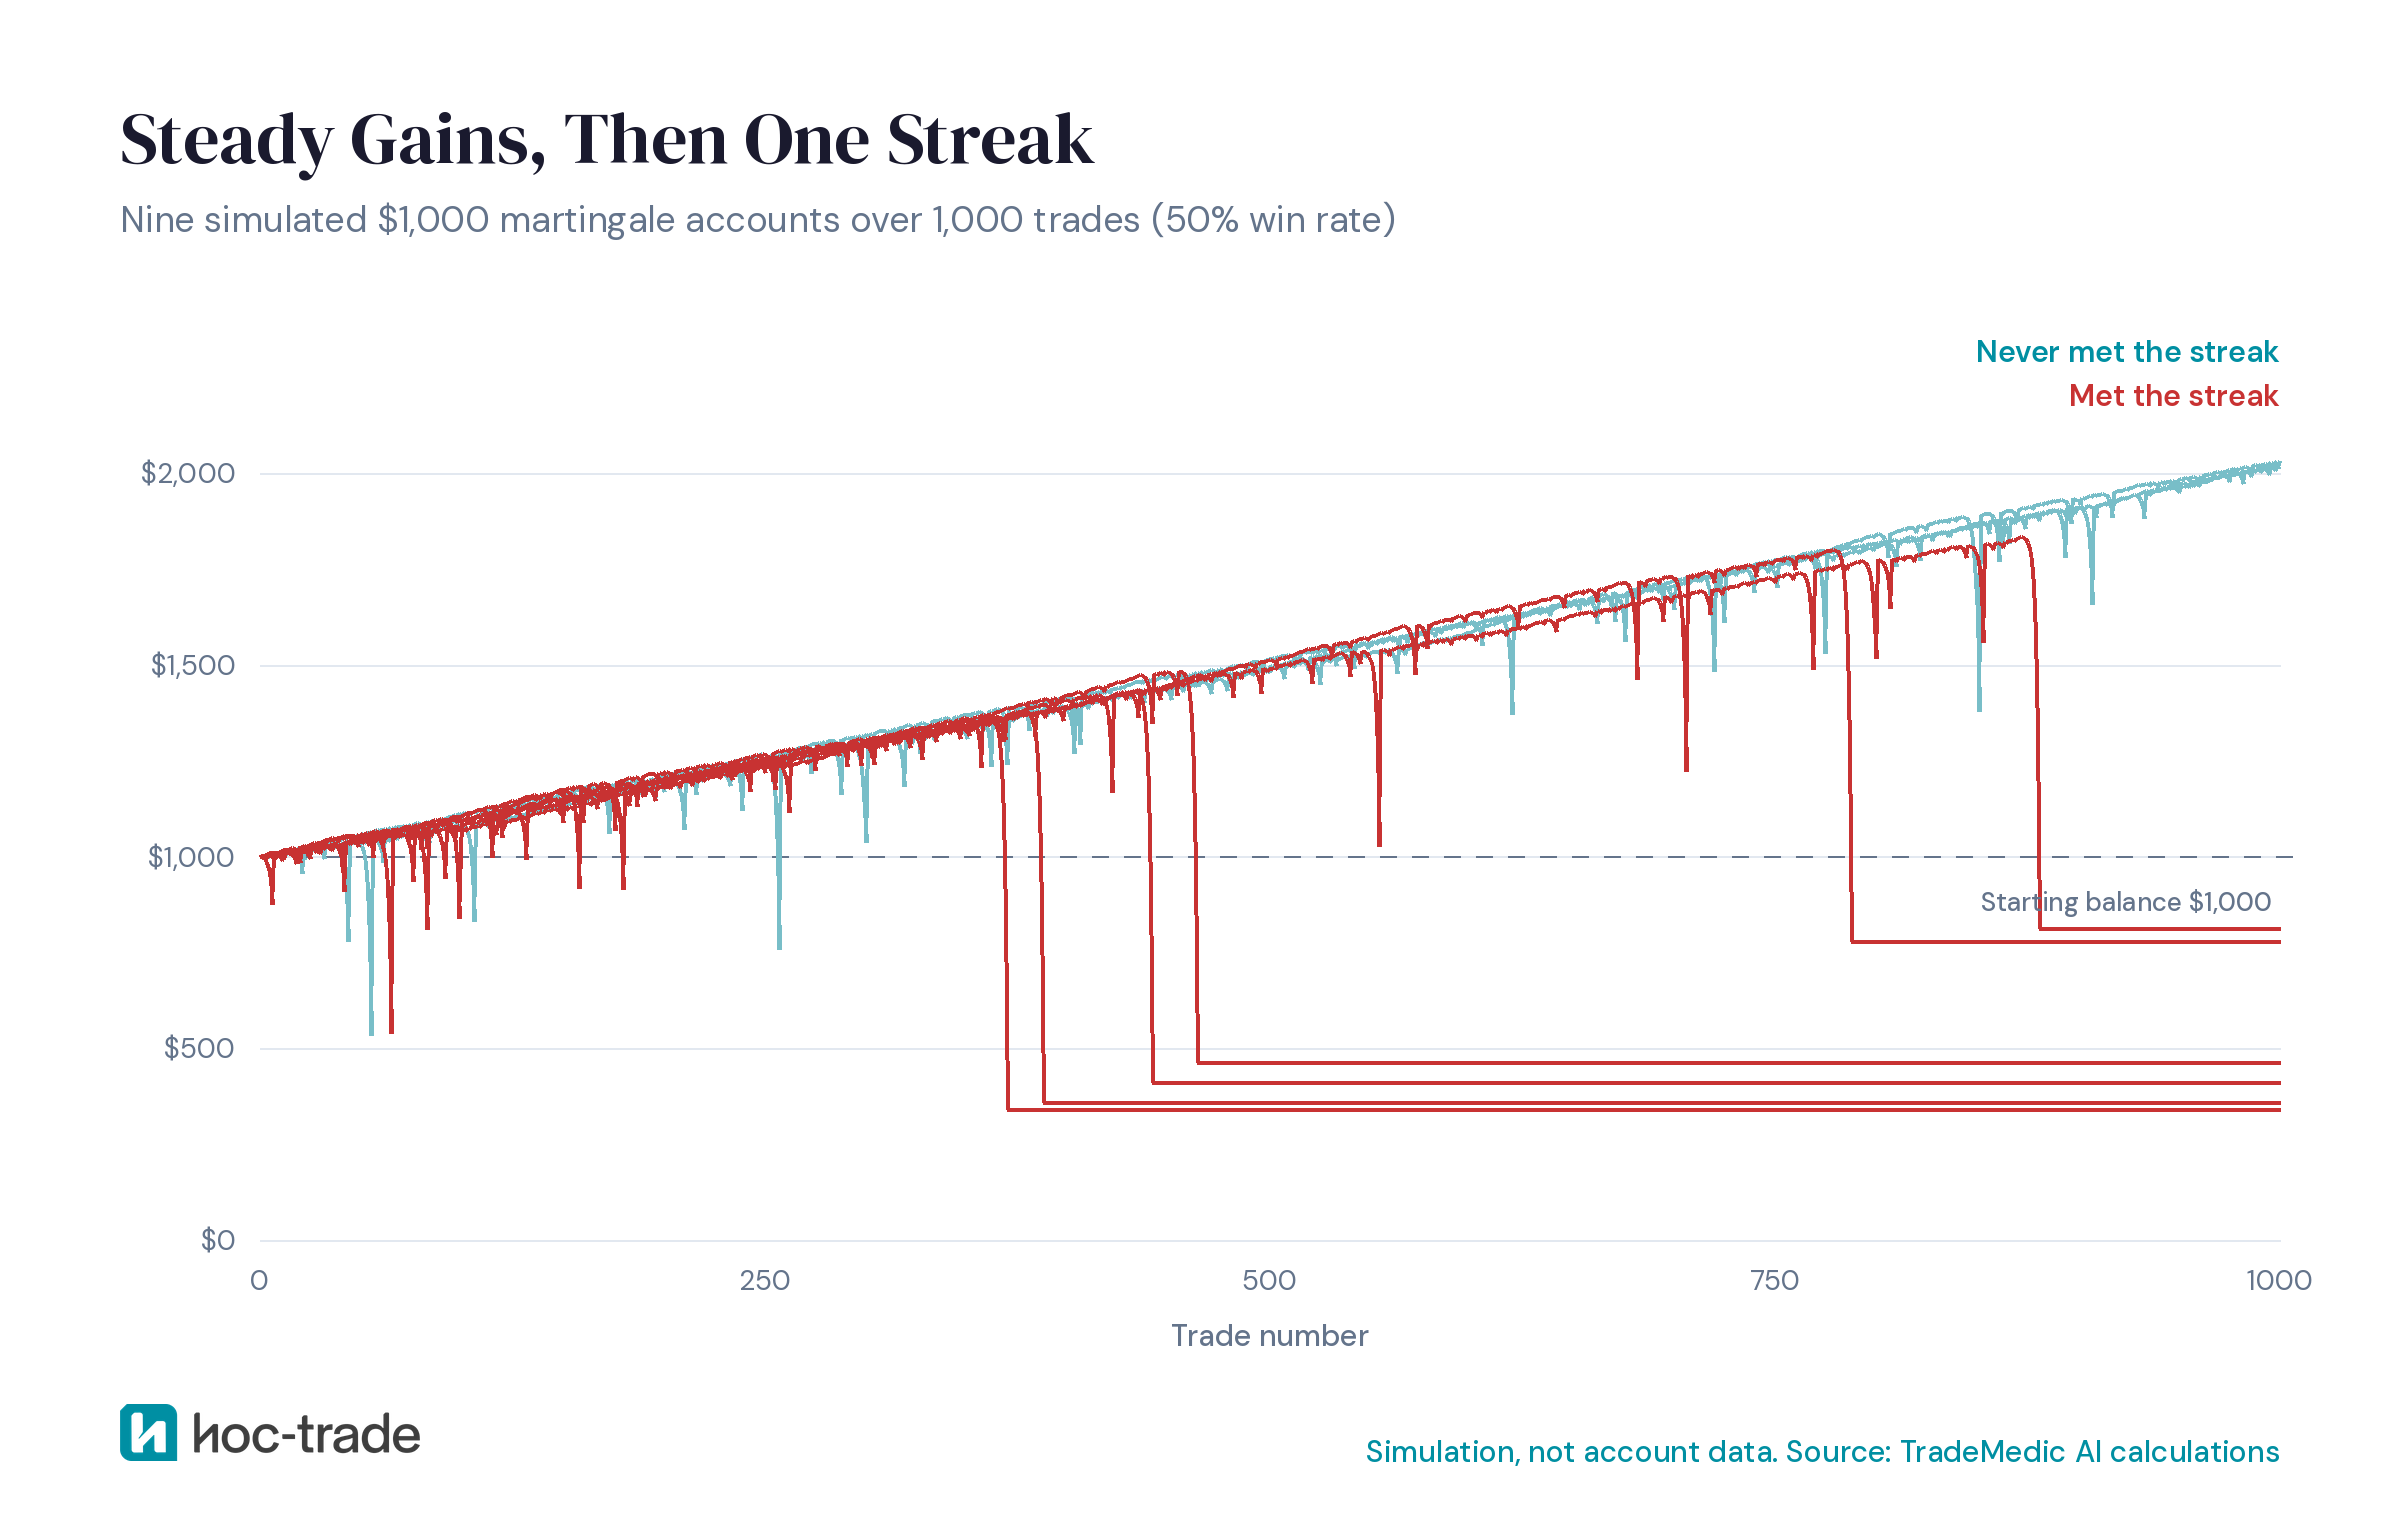
Can a bigger account make martingale safe?
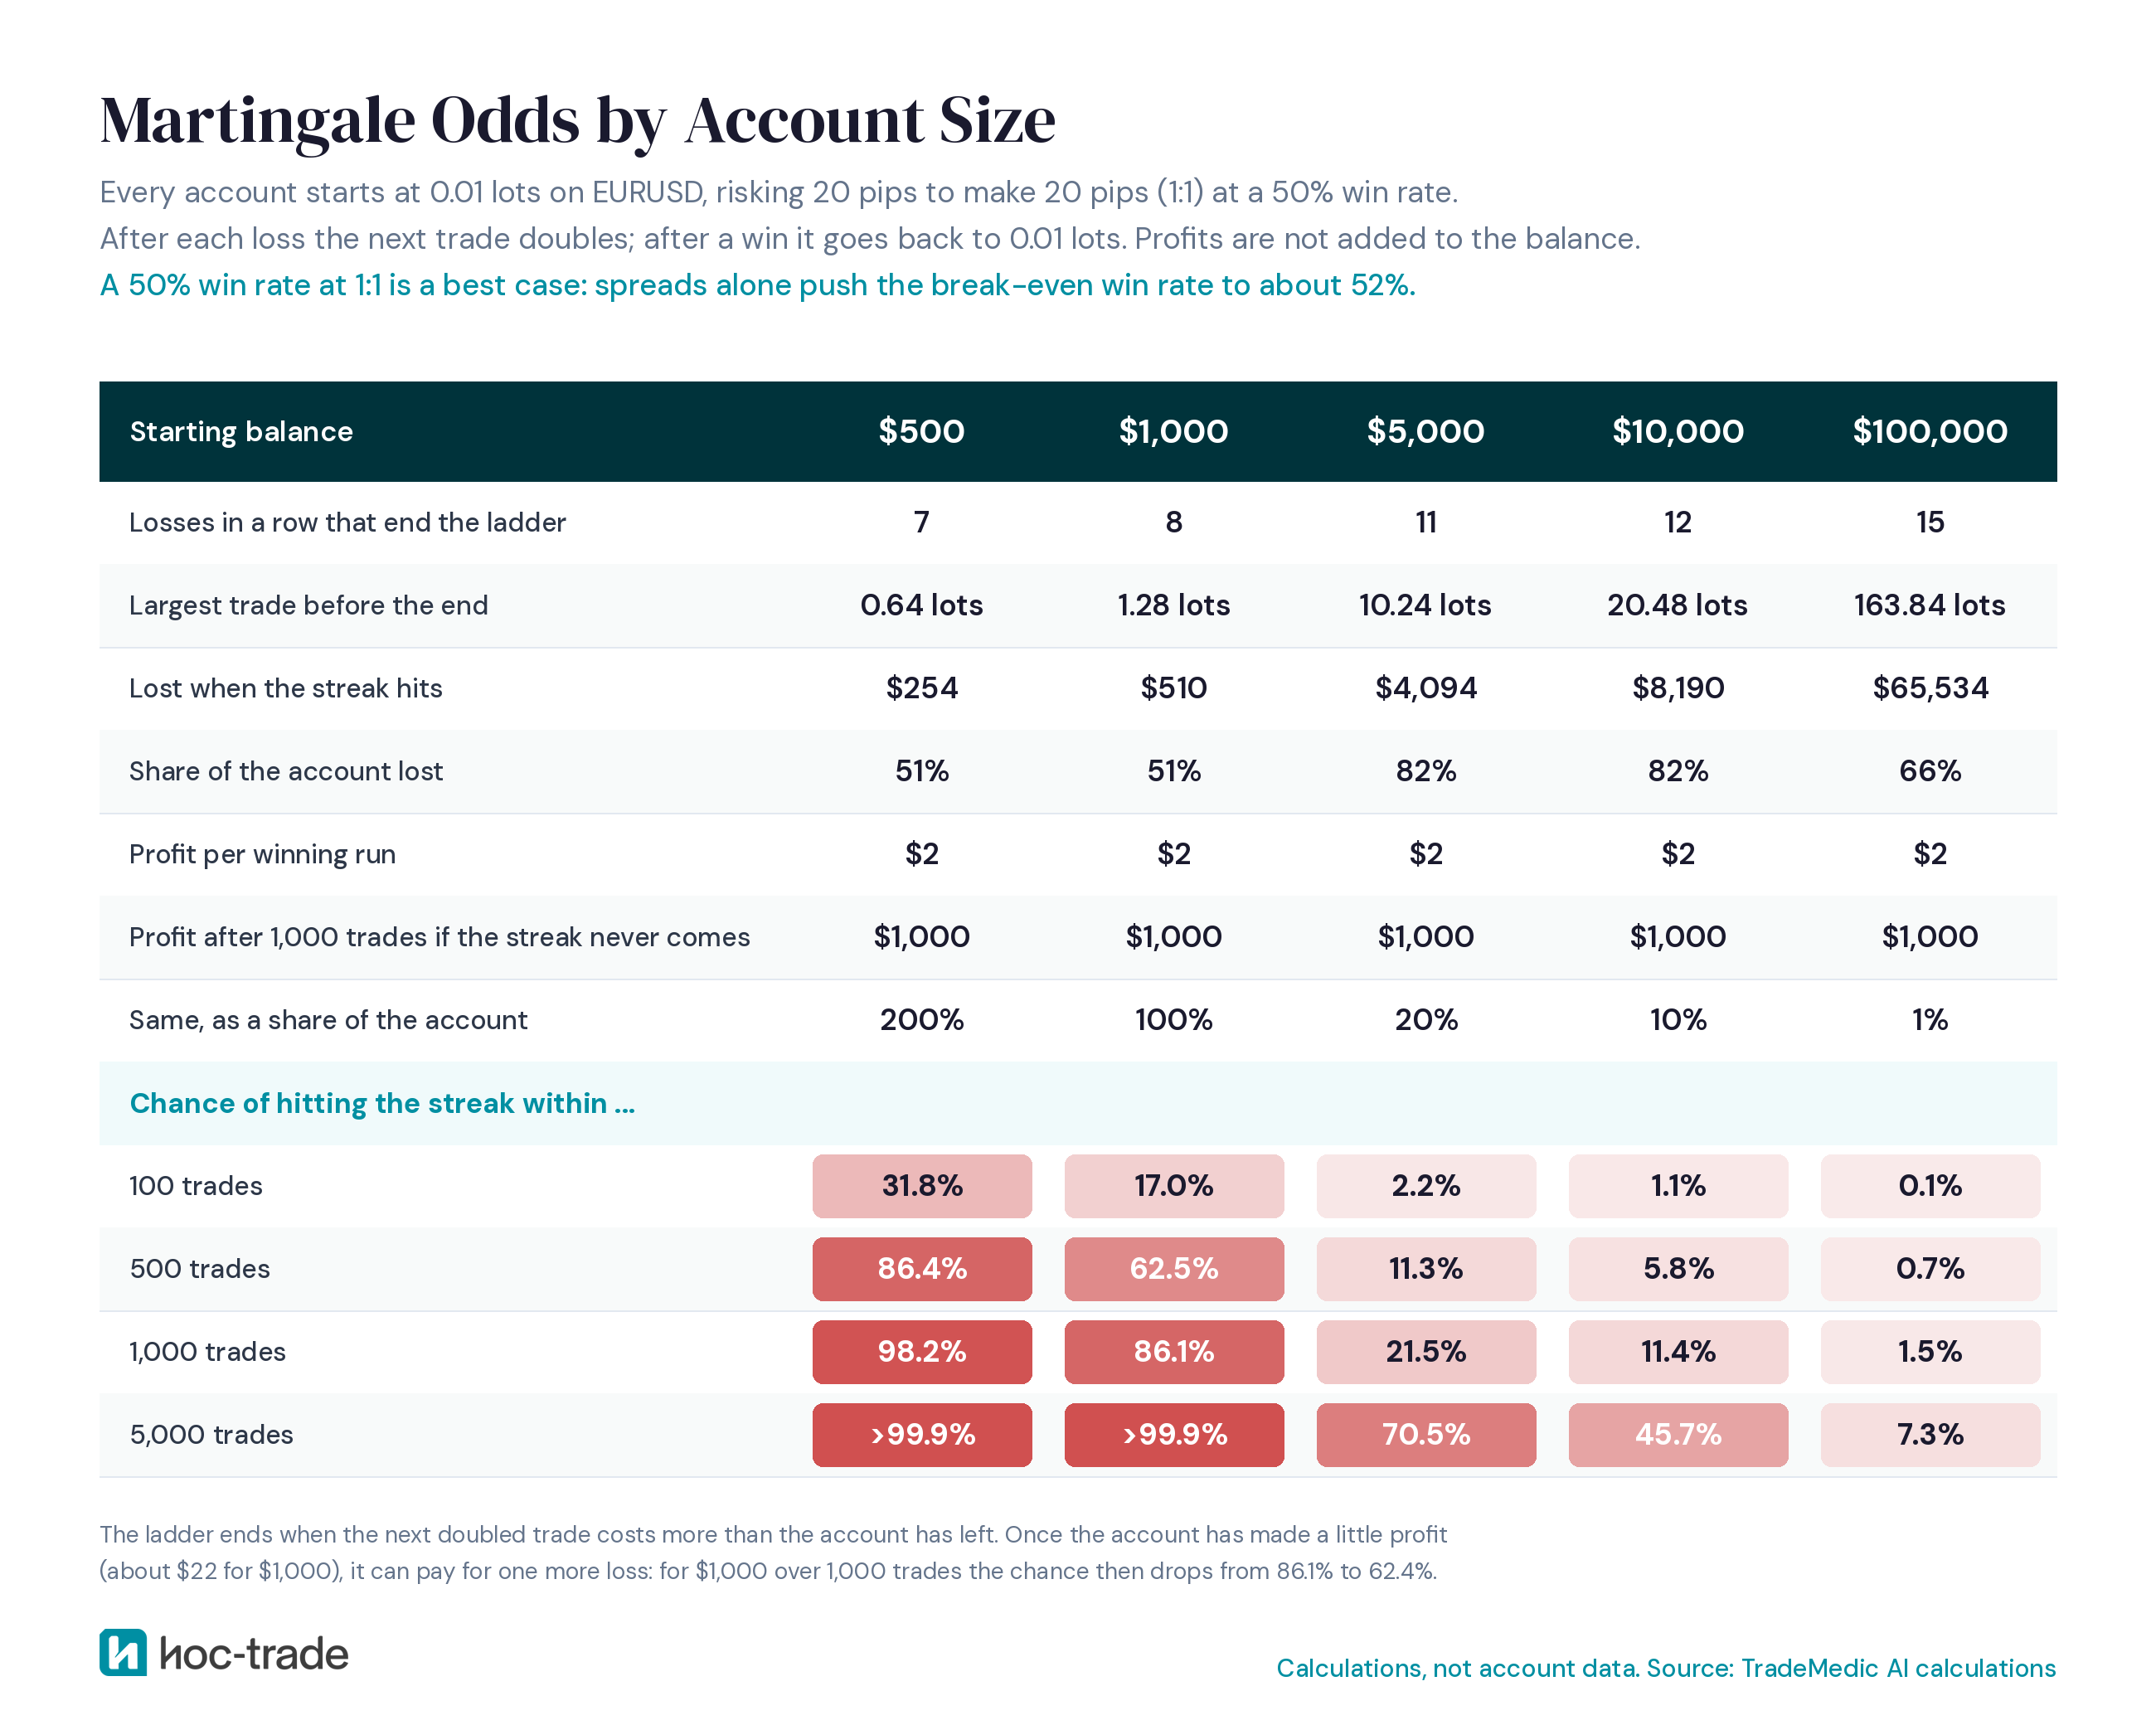
A bigger account buys a few more losses, not safety. With the same 0.01-lot start, a $10,000 account runs out after 12 losses in a row instead of 8. At a 50% win rate, the chance of 12 losses in a row within 1,000 trades is still about 11%, and it keeps rising with every trade after that.
The catch is in the doubling itself. Every extra loss the account can survive needs as much money as all the losses before it combined. Going from 8 losses to 12 takes ten times the capital, and the reward per completed run stays at one starting stake. The table shows the same ladder for five account sizes.
What happens to martingale at 30:1 leverage?
For most retail traders, the margin limit ends the ladder long before the money does. At 30:1 leverage, the usual limit on major currency pairs for retail clients in the EU, the UK and Australia, a $1,000 account can open at most about 0.26 lots of EURUSD.
The ladder needs 0.32 lots after just 5 losses in a row.
At a 50% win rate, a run of 5 losses within 1,000 trades is close to certain.
So on a regulated account, the classic martingale stops after 5 losses with $62 lost, and the system simply cannot continue. It only runs further at brokers that offer very high leverage, which is also where a full streak can take most of the account. The same leverage wall stops the 20 pip challenge at level 1.
Is a martingale grid trading strategy safer?
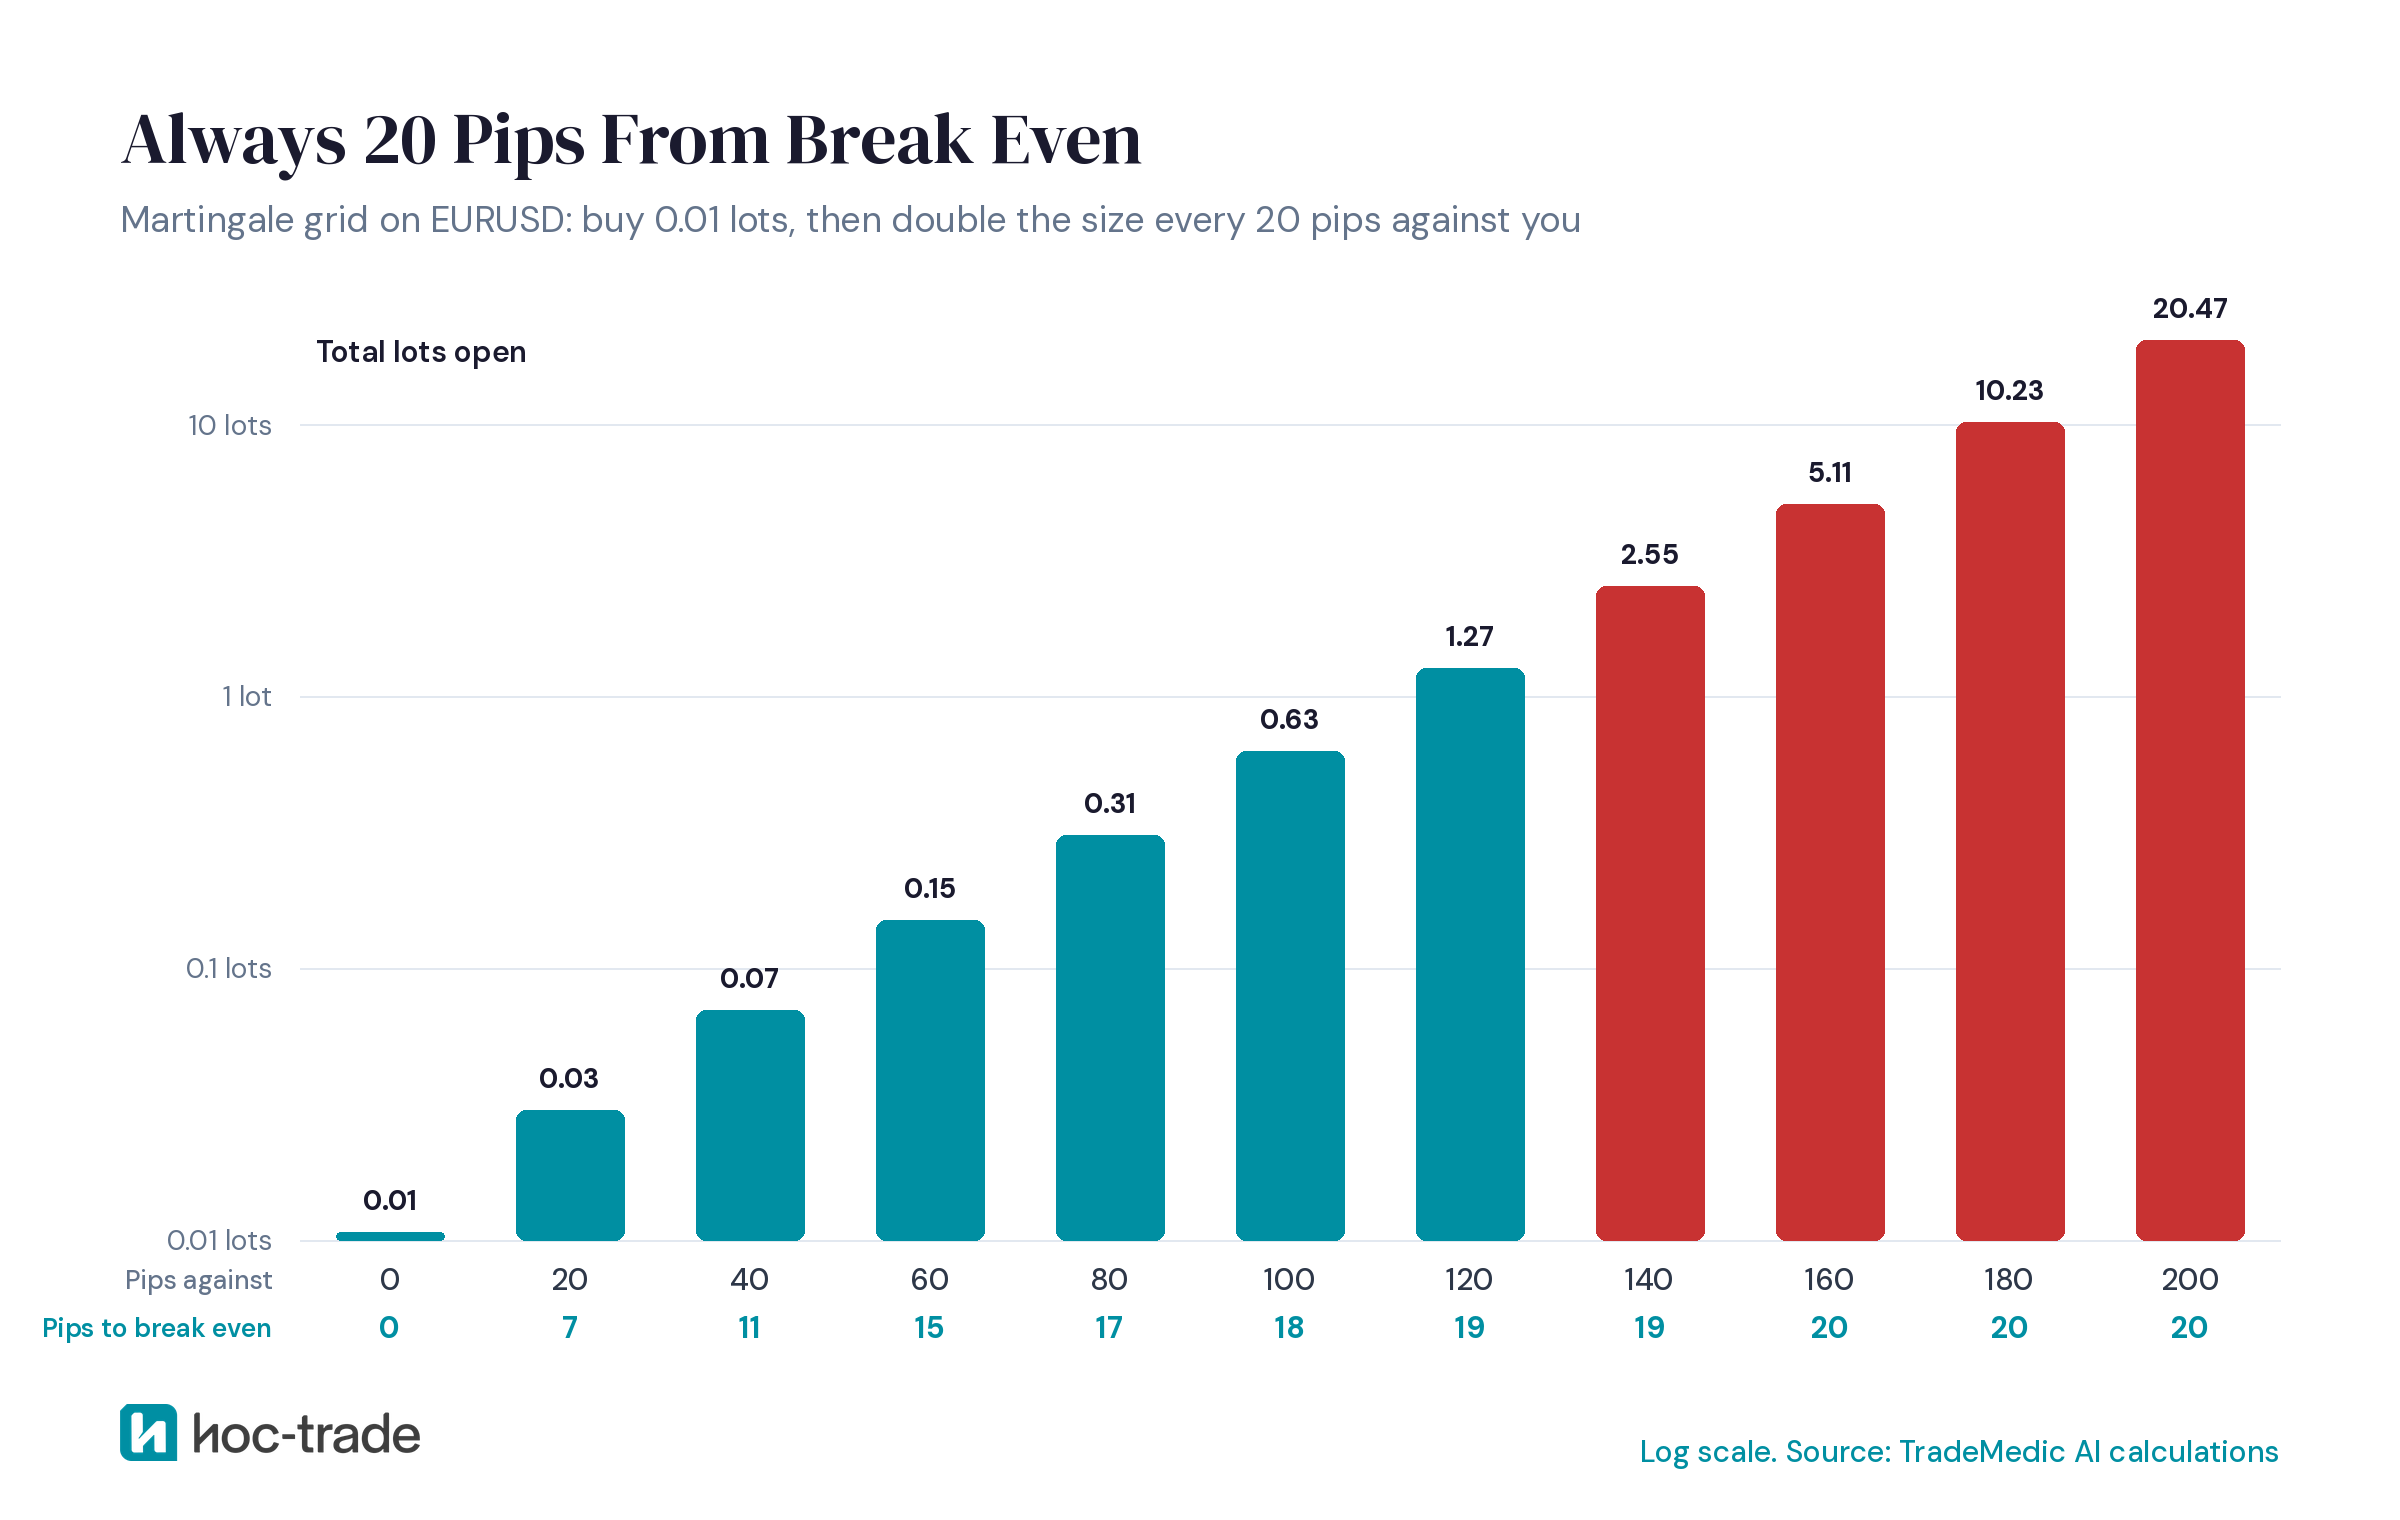
Grid robots look safer because the position always seems close to breaking even. Here is a common setup: buy 0.01 lots of EURUSD, and every 20 pips the price falls, buy again at double the last size.
After 60 pips against you, 0.15 lots are open and the floating loss is $22.
After 140 pips, 2.55 lots are open, the floating loss is $494, and the margin needed at 30:1 leverage is about $9,775.
After 200 pips, 20.47 lots are open and the floating loss is $4,072.
At every one of these points, the price only needs to come back about 15 to 20 pips for the whole grid to break even. That is the trap. The distance to break even barely changes, so the position always feels one small bounce away from fine, while the size of the bet doubles at every level. A grid does not need the market to turn eventually. It needs it to turn before the account or the margin runs out. Grids also tend to hold their positions for days, and swap is charged on the full, growing size every night.
Grids that add the same size at every level grow more slowly, but they still add to a losing position each time. TradeMedic AI flags this as inefficient hedging when positions in both directions erode results, and as doubling down when the additions run in one direction.
How many pips until a martingale grid hits a margin call?
Fewer than most grid traders expect, and fewer still with high leverage. We ran the same grid, 0.01 lots doubling every 20 pips, until the broker would close it at a 50% margin level, the stop-out rule for retail clients in the EU. The grid opens a new level only while the account has enough free margin for it, and closes all positions in profit as soon as the price comes back about 20 pips to its break even. The figures below are the worst case: a move straight against the grid, with no pullback large enough to reach that target.
A $1,000 account at 500:1 leverage is stopped out after about 168 pips, with 1.27 lots open and $855 lost.
A $10,000 account at 500:1 lasts about 218 pips. Ten times the money buys about 50 more pips.
A $1,000 account at 30:1 lasts about 520 pips, but only because the margin limit stops the grid after 4 levels. By then it is a 0.15 lot position that has lost $713.
High leverage does not give a grid more room. It lets the grid keep doubling, so the position grows until a move of under 200 pips without a 20 pip pullback is enough to close it. Low leverage stops the doubling early, and the grid turns into a plain losing position with no plan left to rescue it. Either way, about three quarters or more of the account is gone when the broker steps in. With a lower stop-out level of 20%, as some high-leverage brokers use, the 500:1 account lasts about 175 pips instead of 168.
What is the best pair for a martingale strategy?
Martingale traders usually pick one of two kinds of symbol: one with a low cost per trade, or one that tends to swing back and forth in a range. Neither makes the strategy safe (our guide to the best forex pair to trade covers pair choice more broadly), because neither removes the one thing that breaks it: a long move in one direction.
Gold is cheap to trade relative to how far it moves, but that is the problem. Gold moves much further in a day than most currency pairs, so a ladder or grid with the same step gets overrun far faster. In TradeMedic AI data, 17.7% of accounts that trade gold as their main symbol are profitable, slightly below the 18.2% across all accounts.
Range-bound pairs such as AUDCAD are a favourite of grid robots for the opposite reason: they tend to come back. In TradeMedic AI data, 42.2% of accounts whose main symbol is AUDCAD are profitable, the highest share of any symbol we track. That looks like a case for martingale, but it is also exactly what the simulation above predicts: accounts that have not met their long move yet look excellent. Our data cannot tell which of these accounts run a grid, or how many will meet that move later. A pair that ranges for months can still trend for weeks, and a martingale only needs that to happen once.
What does a deep martingale run do to your decisions?
The maths assumes a trader who follows the rule calmly to the last step. In practice, a run of 6, 7 or 8 losses means watching a floating loss grow to many times your usual size, often for hours or days. That is when other habits take over: moving or removing the stop, adding outside the plan, switching the robot off at the worst moment or betting on a reversal that is not there.
TradeMedic AI data shows how often these habits travel together. They all point the same way: trading against the market while a position is losing.
78.9% of traders affected by doubling down also show emotional trading. Across all traders, the share is 57.3%.
62.8% of traders affected by doubling down also catch falling knives, buying into sharp drops. Across all traders, it is 46.0%.
50.2% of traders affected by doubling down also fight the trend. Across all traders, it is 35.8%.
A martingale is often chosen because it seems to take emotion out of trading. The data suggests the opposite: the habit at its core comes with more emotional trading, not less.
How common is martingale-style trading in real accounts?
TradeMedic AI does not label anyone a martingale trader, but it measures the two habits martingale is made of: doubling down and raising risk after losses. Doubling down is both common and the most expensive pattern in our data.
Doubling down, adding to a losing position in the same symbol and direction, has a measurable negative effect on the results of 46.5% of traders.
Among the traders it affects, doubling down causes 32.5% of their losses, an average of $9,988 per trader. No other pattern takes a larger share.
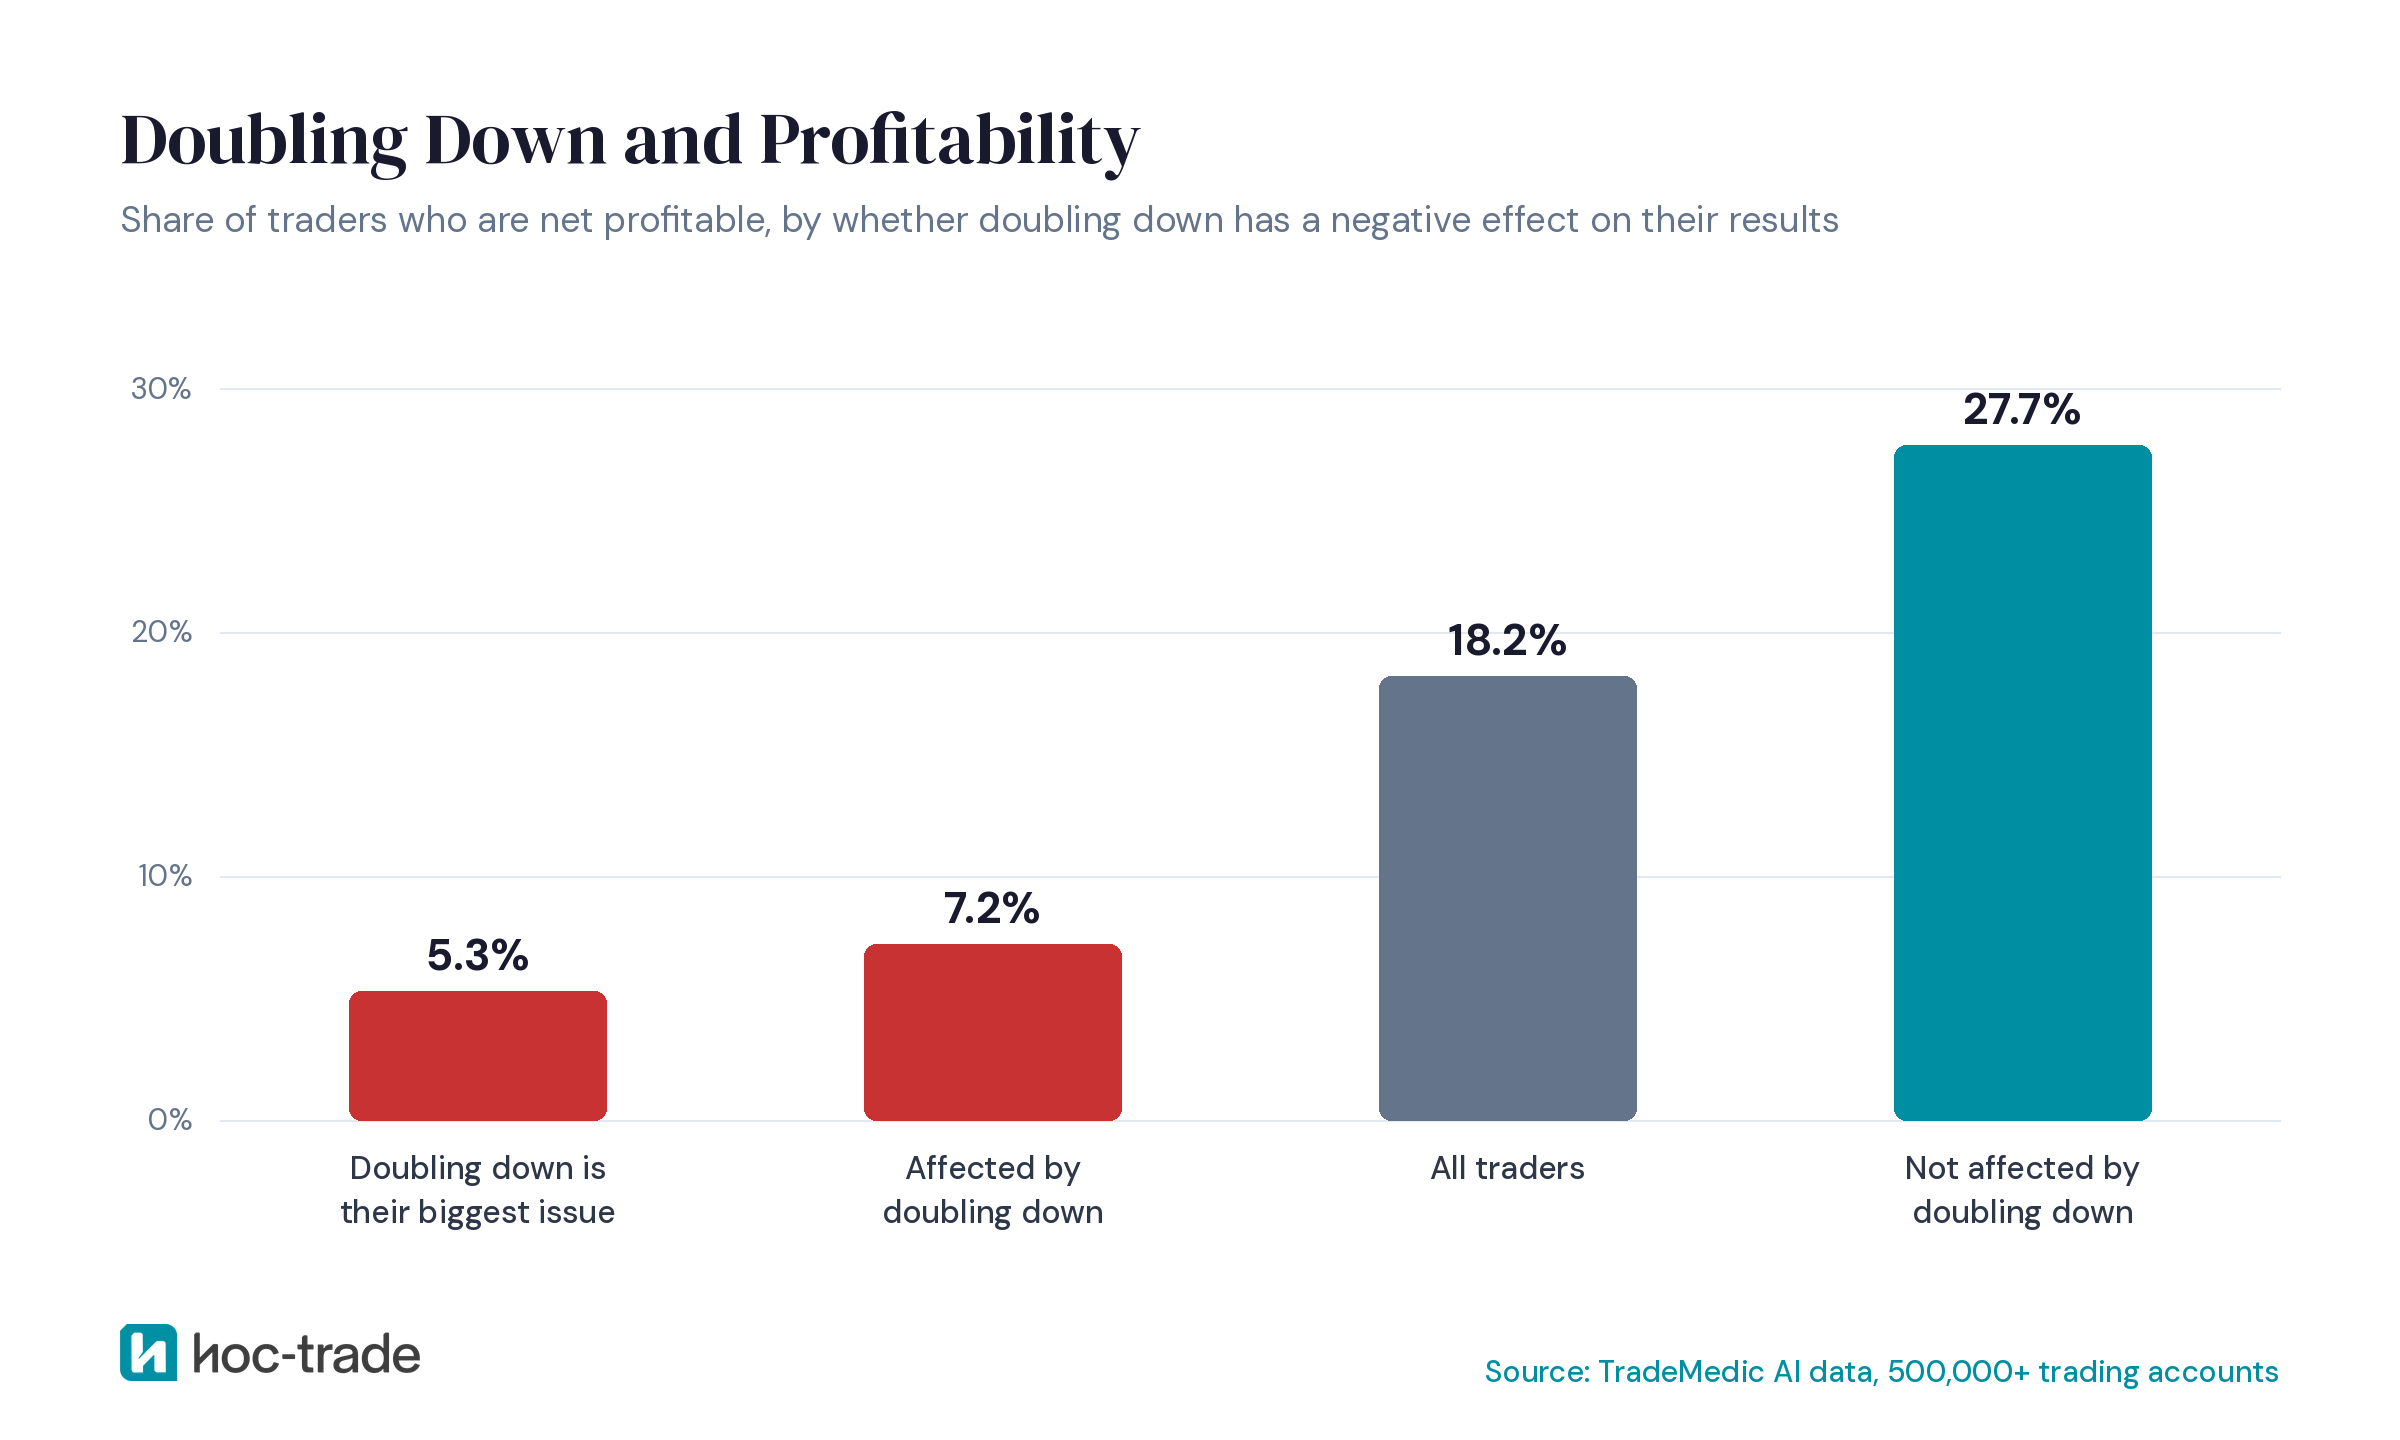
Among traders affected by doubling down, only 7.2% are profitable. Among traders where it has no negative effect, 27.7% are.
The second habit, raising risk after losses, is what TradeMedic AI detects as an emotional loss streak: it shows whether your trades get bigger after a losing run, and how those bigger trades perform.
Doubling down is most common among swing traders: it is a top-five issue for 34.7% of swing traders, compared with 20.5% of day traders and 8.7% of scalpers. Longer holding periods leave more time for a position to move against you, and more chances to add to it.
Do your trades grow after a loss? Most traders never check. TradeMedic AI compares your risk per trade after losing runs with your usual size, and shows whether the trades you added to losing positions performed worse than the rest.
See if you size up after lossesWhat to do instead of the martingale strategy
The alternative to martingale is not a cleverer sizing rule. It is keeping each trade small enough that no single run of losses matters. TradeMedic AI data points the same way.
Keep risk per trade fixed and small. In TradeMedic AI data, 24.5% of accounts whose average losing trade costs less than 0.5% of the balance are profitable, compared with 13.4% of accounts whose average loss is 2% to 5%. Our guide on how much to risk per trade covers the full range.
Never size the next trade from the last result. Decide the size from your stop distance and your fixed risk, not from whether the last trade won or lost.
Decide your maximum position before you enter. If you scale into trades at all, plan the levels, the total size and one stop loss for the whole position in advance, so the worst case is known before the first order.
Look for the edge in the trades, not in the sizing. If a strategy does not make money at a fixed size, no sizing rule will fix it. Our comparison of risk-reward ratio vs win rate shows what separates profitable accounts.
Check combined risk, not just single trades. A grid of small positions can add up to one very large one. TradeMedic AI flags all-in trades when the open positions together risk more than half the account.
How TradeMedic AI shows whether you trade like a martingale
TradeMedic AI connects to your MT4 or MT5 account with a read-only investor password and analyses your full trade history. It shows whether your risk per trade rises after losses, whether the trades you added to losing positions performed worse than the rest, and how many open losing positions it takes before your additions turn negative, each with the dollar effect from your own trades and real example trades.
It works the same way for trades placed by an EA, so if you run a grid or recovery robot, you can see exactly what it has been doing with your account.
Would one long losing run break your account? TradeMedic AI shows your risk after losses, your additions to losing trades and the combined risk of your open positions, all from your own history.
See how TradeMedic AI worksResearch behind this article
The account figures in this article come from TradeMedic AI data covering 500,000+ trading accounts from many brokers worldwide. A profitability figure means the share of accounts in a group that are net profitable, not a return. Across all accounts, that share is 18.2%.
The ladder, grid, streak odds, leverage limits and the 50,000-account simulation are our own calculations, not account data. They assume EURUSD trades with a 20 pip stop and a 20 pip target, a stop-out at a 50% margin level, $10 per pip per standard lot, EURUSD near 1.15 for margin, and wins that are independent from one trade to the next.
Frequently asked questions
Is the martingale strategy the same as doubling down?
They are closely related. Martingale is a fixed rule that doubles the position after every loss, while doubling down is the broader habit of adding to any losing position. In TradeMedic AI data from 500,000+ trading accounts, doubling down has a negative effect on the results of 46.5% of traders and causes 32.5% of the losses of the traders it affects.
How many losses in a row should I expect when trading?
More than most traders expect. At a 50% win rate, the chance of at least one run of 9 losses in a row within 1,000 trades is about 62%, and a run of 6 within just 100 trades is about 55%. TradeMedic AI shows how your own trading changes after a run of losses, using your full trade history.
Can martingale turn a losing strategy into a profitable one?
No. A sizing rule cannot add an edge that the trades themselves do not have. In our simulation of 50,000 accounts at a 50% win rate, the average account ended where it started, and at a 48% win rate it ended at about $786 from $1,000. TradeMedic AI shows whether your own trades have an edge before any sizing rule is applied.
What is the best martingale multiplier?
There is no safe one. A multiplier of 1.5 grows more slowly, but one win no longer recovers the run: after 4 losses at a $2 start, $16.25 is lost and the next win pays only $10.12. A multiplier of 2 or more recovers the run but grows exposure faster. TradeMedic AI data points to fixed, small risk per trade instead.
What is the anti-martingale strategy?
Anti-martingale, or reverse martingale, raises the position size after wins and cuts it back after losses, so a losing run costs only the starting stake each time. It still means trading bigger after a win, which raises risk. In TradeMedic AI data, accounts that keep each loss small, below 0.5% of the balance on average, are the most likely to be profitable.
Do martingale EAs work?
They can look profitable for months, because most of their runs end in a small win. The risk sits in the rare long move against the grid, which a backtest over a calm period may never show. TradeMedic AI reads every trade an EA places, including added positions and the combined risk of all open trades, so you can see what the robot is doing.
Is martingale a good strategy for a small account?
It is one of the worst fits. At 30:1 leverage, a $1,000 account cannot open the position martingale needs after 5 losses in a row, and in TradeMedic AI data from 500,000+ trading accounts, 14.3% of accounts that deposit less than $250 are profitable, the lowest share of any deposit group.

Experienced trader and technology builder. Writes on behavioral trading patterns, CFD markets, and what 500,000+ retail accounts reveal about trader performance.