Category:
 Author:
 Date:Aug 15, 2026
What Your TradeMedic Report Shows: A Full Walkthrough

Most traders can name their bad habits. Ask someone who has been trading for two years what they do wrong and you will usually get a reasonable answer. They hold losing trades too long. They get impatient waiting for a setup. They trade more than they should after a bad day.
What almost nobody can tell you is which one is costing the most, and what the priority and the next steps should be.
That gap is a major problem. If you do not know the ranking, you work on whatever feels most uncomfortable rather than whatever is most expensive, and those are unfortunately rarely the same thing.
In our effectiveness study, trades entered without a detected behavioural issue performed 63% better on average than trades entered with one. The classification was made at the moment of entry, before the outcome was known. Same trader, same strategy, same market. What differed was the state the trader and the market was in when they pressed the button.
This article walks through every section of the TradeMedic report, using one account throughout so you can see the full picture and how it helps your trading.
Everything in it comes out of that account's trades. You are not reading a checklist of common mistakes and asking yourself which ones sound like you. You are reading what this trader did, when they did it, and what it cost or made them. You can have the same analysis on your account.
The account used throughout this article is a good demonstration of what you will see in your own report. It covers 4,654 trades across 193 trading days. Every figure shown is produced by the same analysis that runs on a live account.
What happens when you connect a trading account
There is no setup phase. You securely connect an MT4 or MT5 account using an investor password, which is read only and cannot place or close trades, and the analysis runs against your existing trade history immediately. The first report you see already covers everything you have traded on that account.
This matters much more than it sounds, because it removes the reason most traders never get behavioural insight in the first place. A trading journal only tells you something after months of consistent manual entry, and most traders stop before they reach that point. Nothing here depends on you tagging trades, writing notes, or remembering how you felt. The behaviour is already recorded in the timestamps, the position sizes, the entries and the exits.
From that point the report stays live. Every new trade updates it, so the numbers you look at next month are not a snapshot you have to regenerate.
You can also connect more than one account and merge them into a single behavioural picture. That includes past accounts and prop firm challenge accounts, whether the challenge is currently running or ended some time ago. You will be able to access the combined view, but also every individual account on its own, since you may be running different strategies on separate accounts.
What the report finds in your trading
The first thing the report shows is not what you are doing wrong, but what you are doing well.
That ordering is deliberate. TradeMedic detects 25 strengths alongside its improvement opportunities, because knowing what already works is worth as much as knowing what does not. A strength tells you which part of your process to lean on and where to put more of your trading. It is often the easier change to act on as well. Doing more of something you have already shown you can do takes less from you than stopping something you reach for under pressure. It is all about finding the biggest profitability levers for your trading.
In this account, the three strongest patterns are On-fire Days, Trade Ranging Markets and Symbol Focus. Each carries a power score showing its relative weight and a performance effect in dollars: 16,055 USD, 10,760 USD and 8,153 USD respectively. Below them sit the improvement opportunities, in the same card format. Revenge Trading at 100% severity and costing 18,240 USD, Cut Profits Early at 61.74% and costing 11,260 USD, Fighting The Trend at 52.54% and costing 9,583 USD.
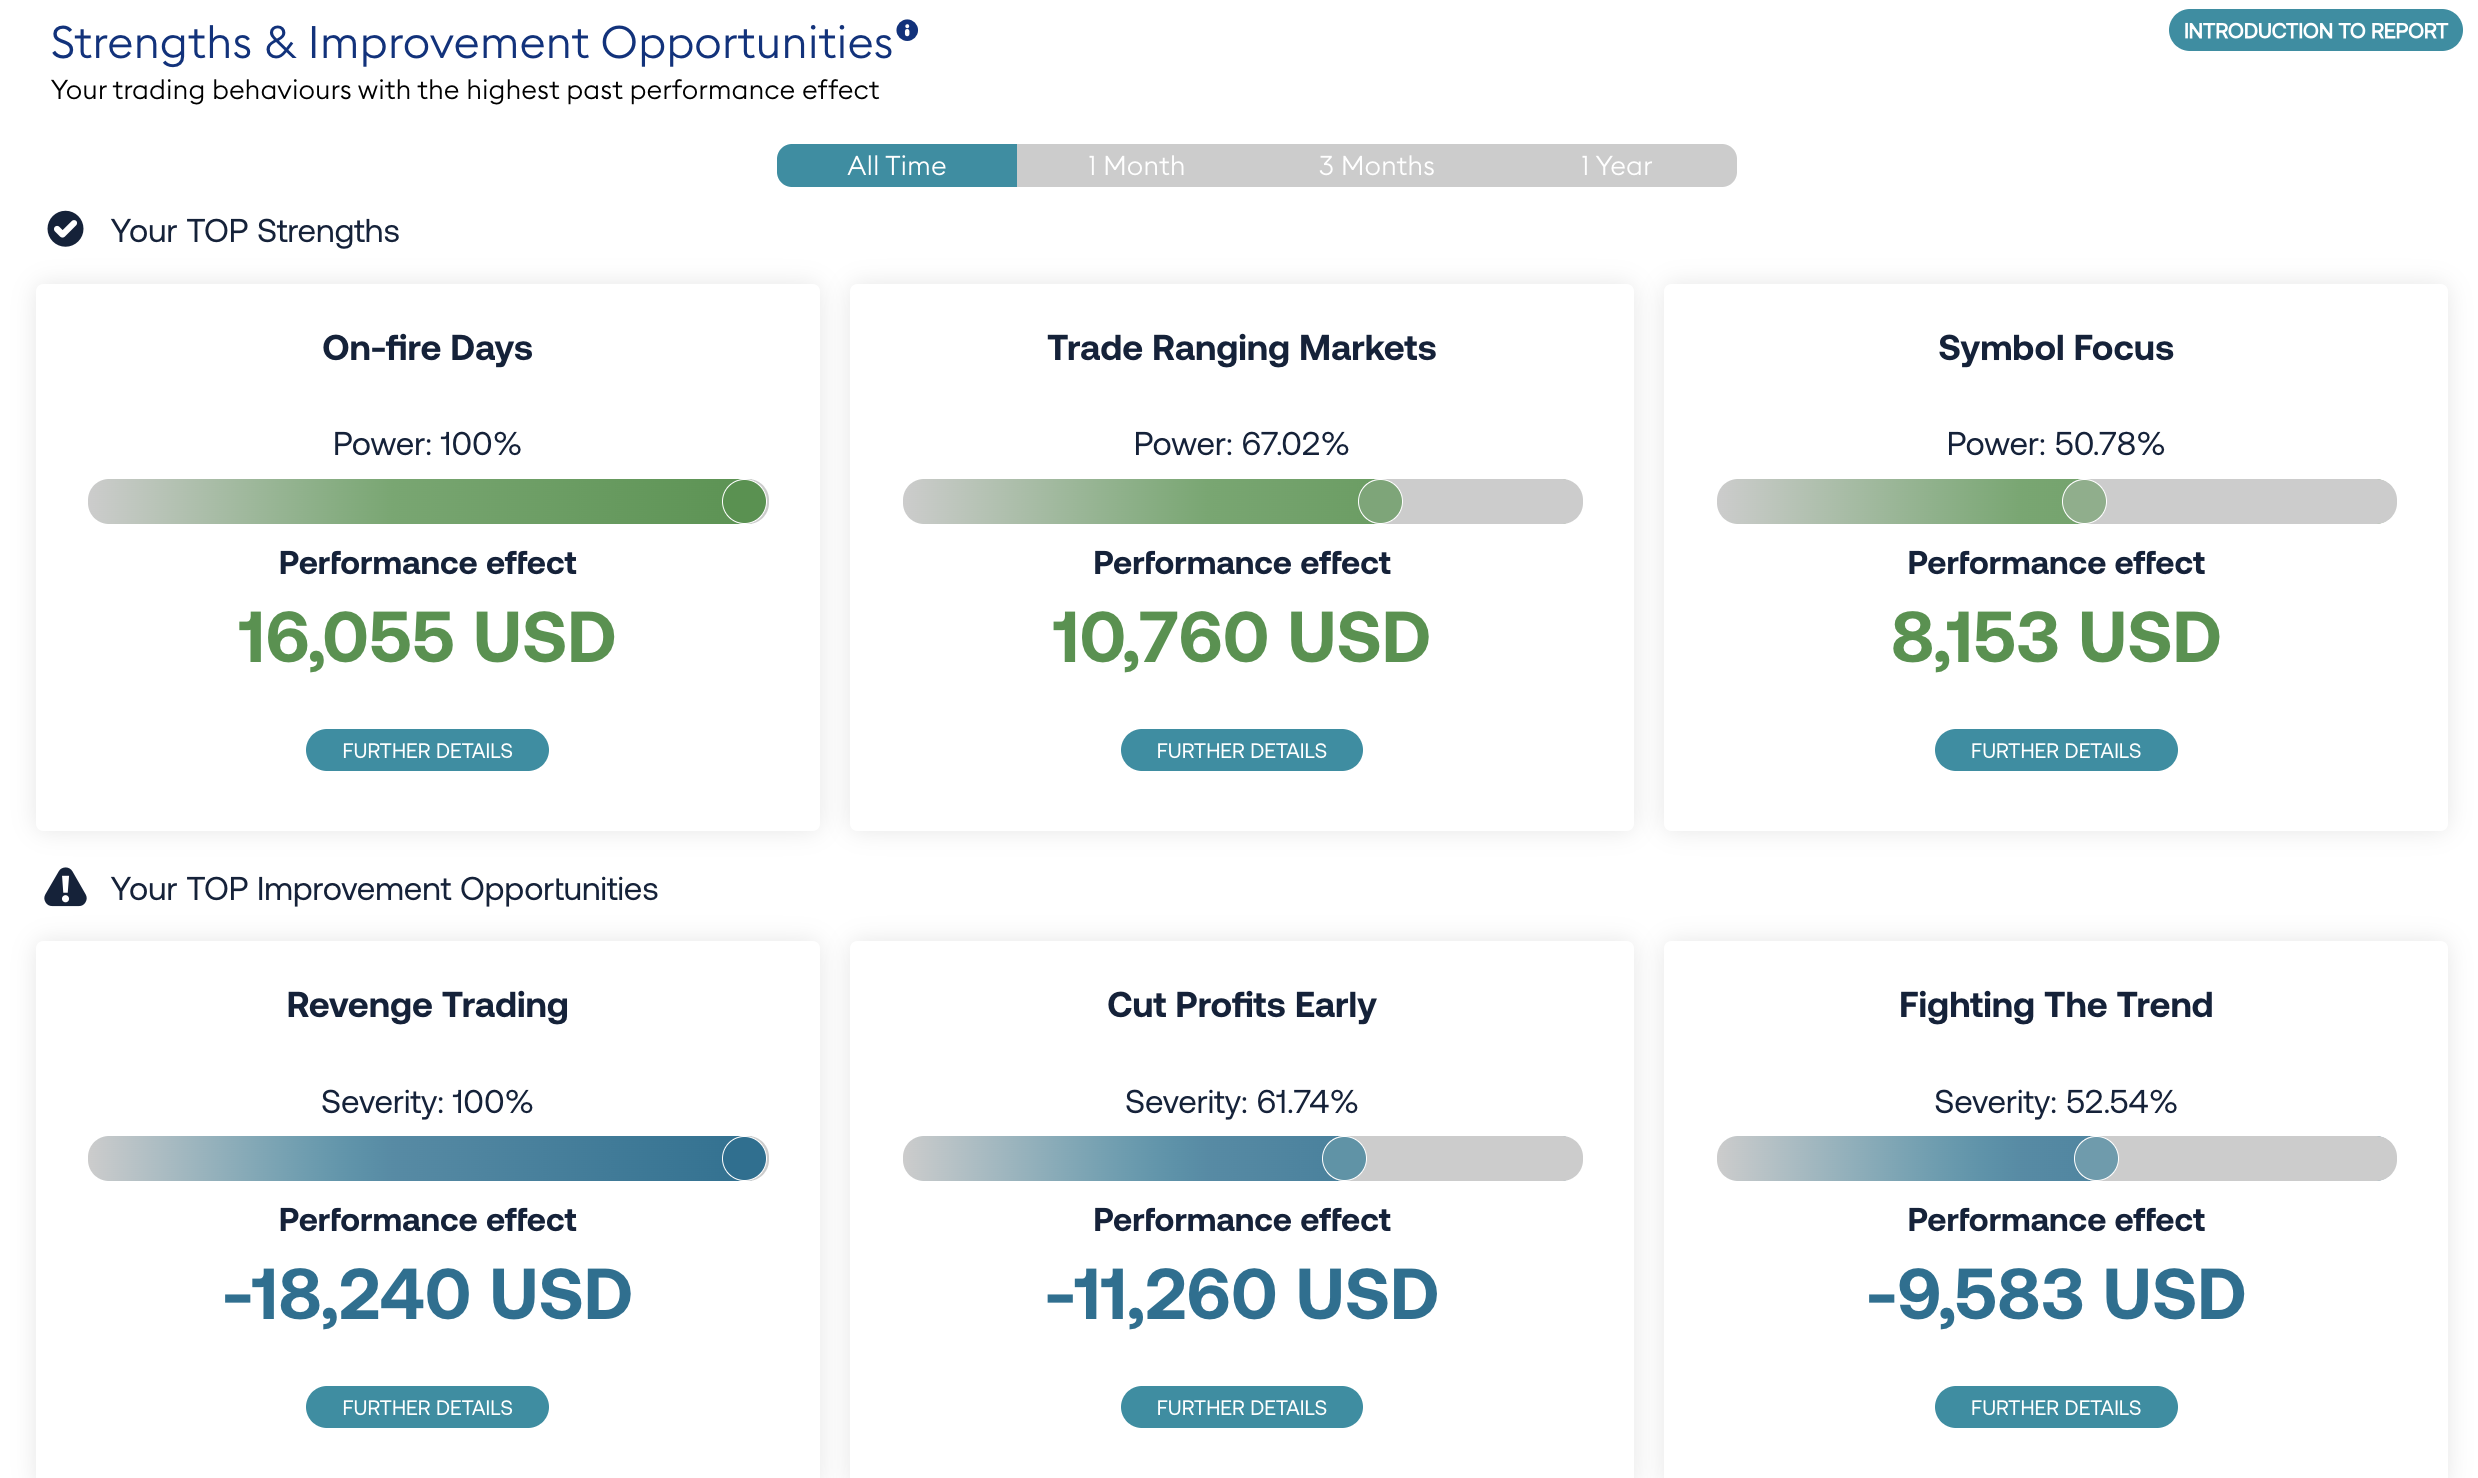
Nothing was tagged to produce this. No pattern was selected from a menu. The detection runs across more than sixty behaviours and surfaces the ones that show a measurable relationship with this trader's results.
Which means no two reports contain the same set. There is no fixed panel of analyses shown to everyone with your own numbers dropped into it. You are not scrolling past sections that do not apply to you to find the ones that do. A trader whose results are unaffected by how long they wait after a losing trade will not see revenge trading in their report at all, and a trader who never trades high volatility positions and news events will not see news trading.
What a single finding looks like in detail
A dollar figure on a card is a claim, but opening the card is where the evidence sits.
Every strength and improvement opportunity opens into a detail view, and it answers four questions in the same order every time. What was found in your account and what to do about it. What this pattern is, if the term is new to you. What the evidence looks like across your trades. And which of your trades it came from. You can stop after the first answer or go all the way down to a trade ID, and you can filter any of it to all time, the last year, three months or one month.
If you read one line per finding, read this one
Under the header sits a plain language summary of what the analysis found in your account. Not a definition and not a general warning. Your threshold, your number, and what to do about it. For revenge trading in this account it reads:
"Revenge trades with a break of 5m-10m and less after a previous losing trade made you a total loss of 18,239.68 USD. Taking a break of min. 5m-10m may prevent emotional decisions and help your overall performance."
There are three things in that sentence that matter for this trader.
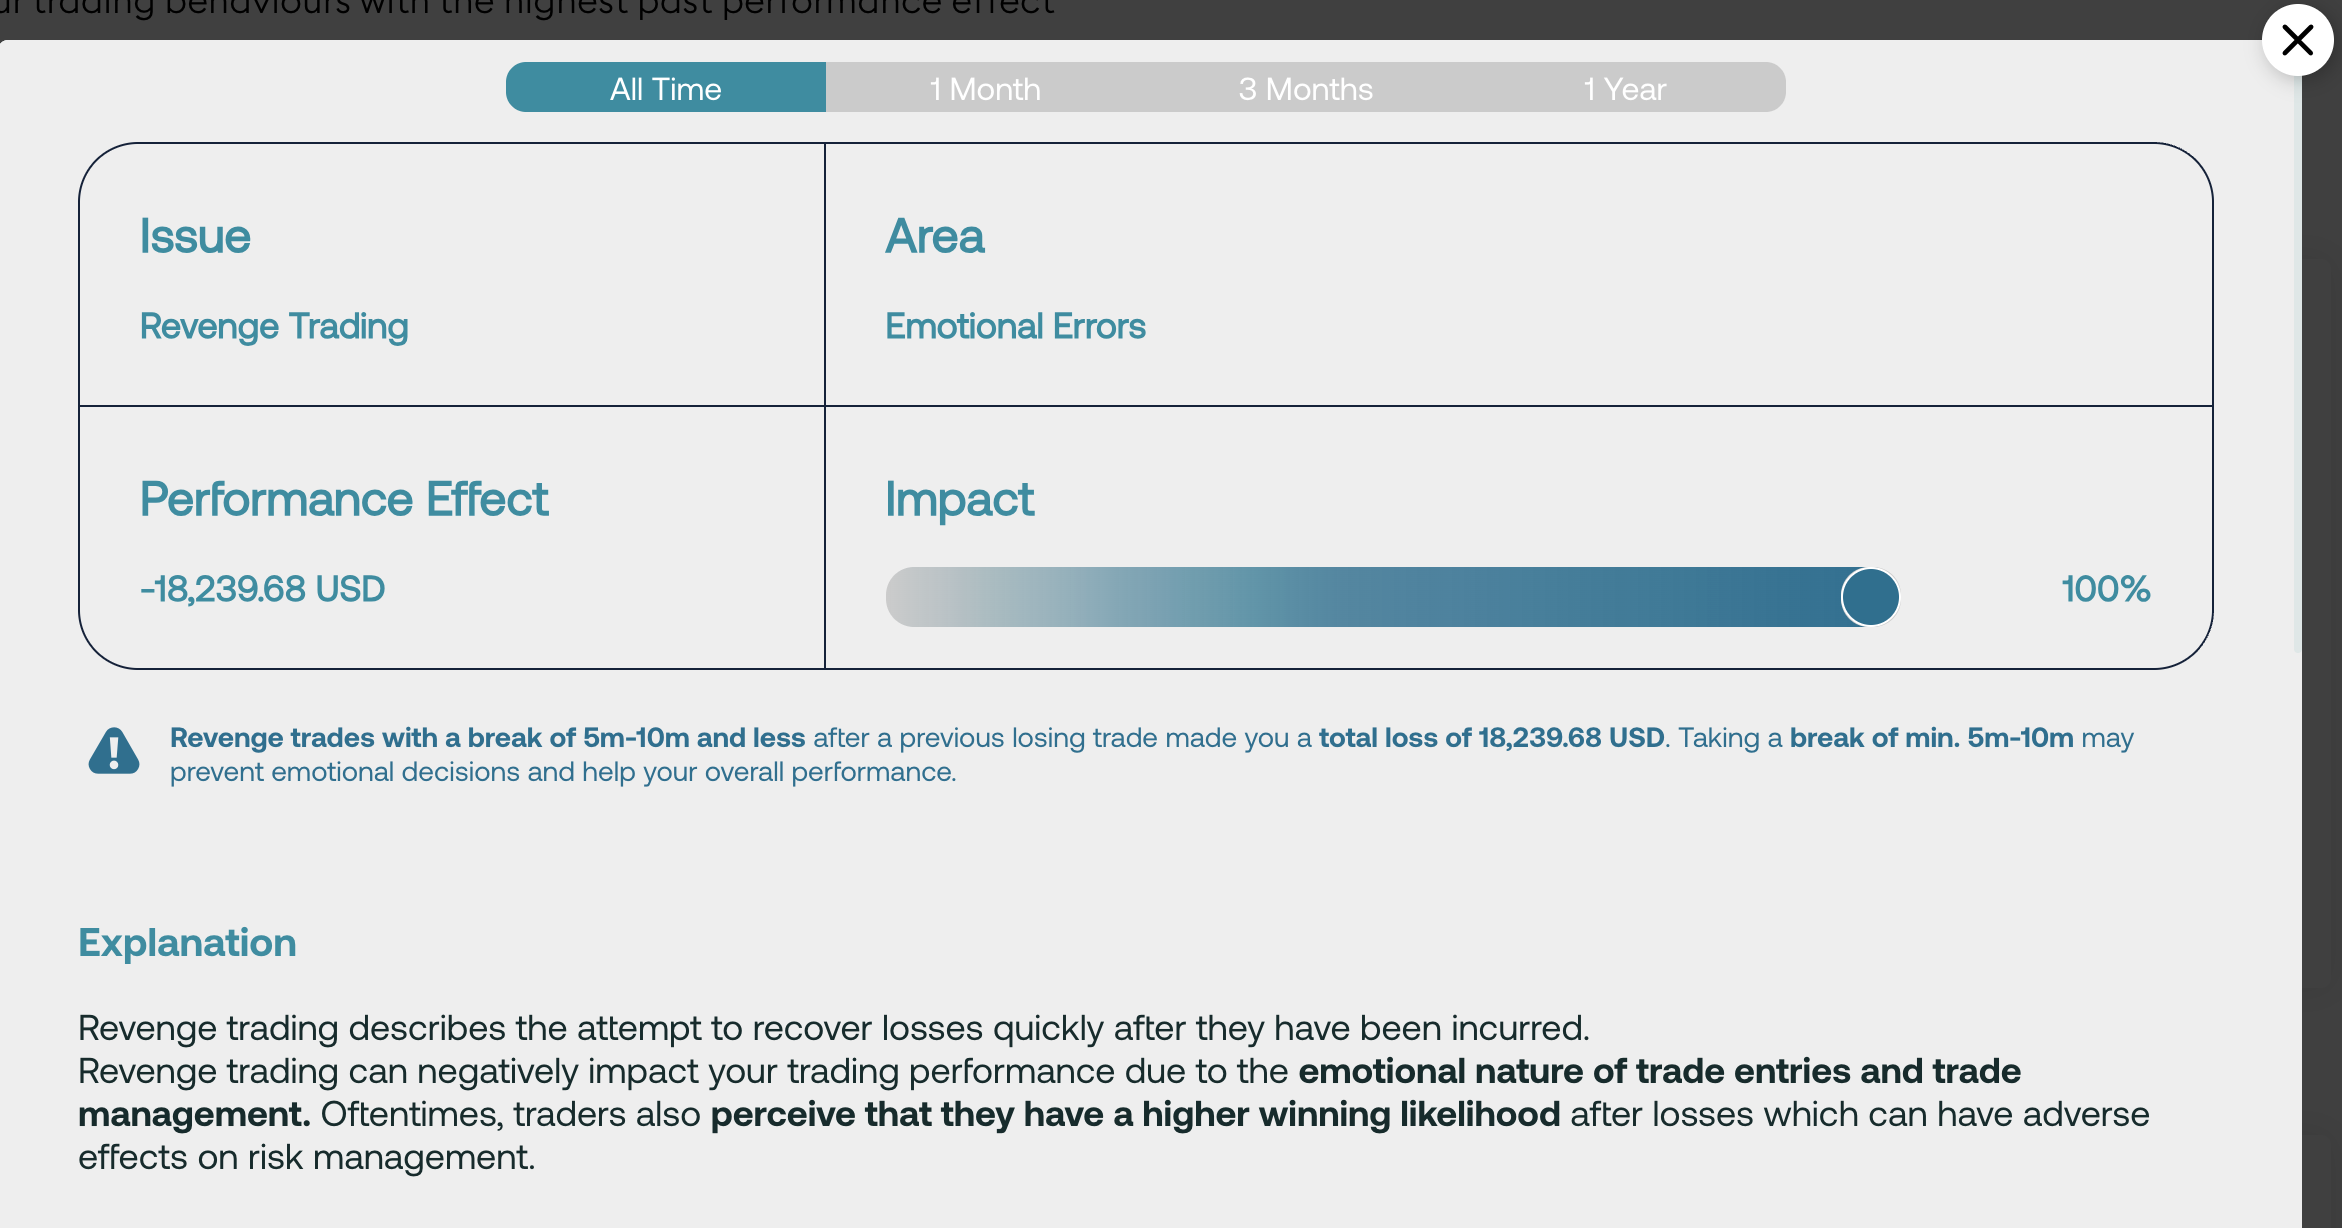
The first is the threshold. Five to ten minutes is where the relationship between break length and results turns negative in this account. It is not a rule applied to everyone. A different trader gets a different window, and a trader whose results show no relationship to break length does not get this finding at all.
The second is the number, and where it comes from. The 18,239.68 USD is not a projection or an estimate of what might have been. It is the sum of what happened in the trades that met the condition. You can watch it add up in the chart directly below: the two right hand bars, the trades opened within ten minutes of a loss and within five minutes of a loss, come to that figure between them. Every finding in the report works this way, and every one can be traced back to the trades it was built from.
The third is what to do next. The recommendation names the same window back, so the action is specific. Wait at least five to ten minutes after a loss before entering again. Not a suggestion to be more patient in general.
The explanation, and what it is for
Below that sits a plain language explanation of the pattern: what revenge trading is, why attempting to recover a loss quickly tends to work against a trader, and how the perception of being due a win after a loss affects risk decisions. If the term is new to you, this is where you pick it up, without having to search for it.
The chart your finding came from
Under that is a bar chart built from your own trades. For revenge trading the horizontal axis is the break taken after a losing trade, and the vertical axis is your average result per trade in each band.
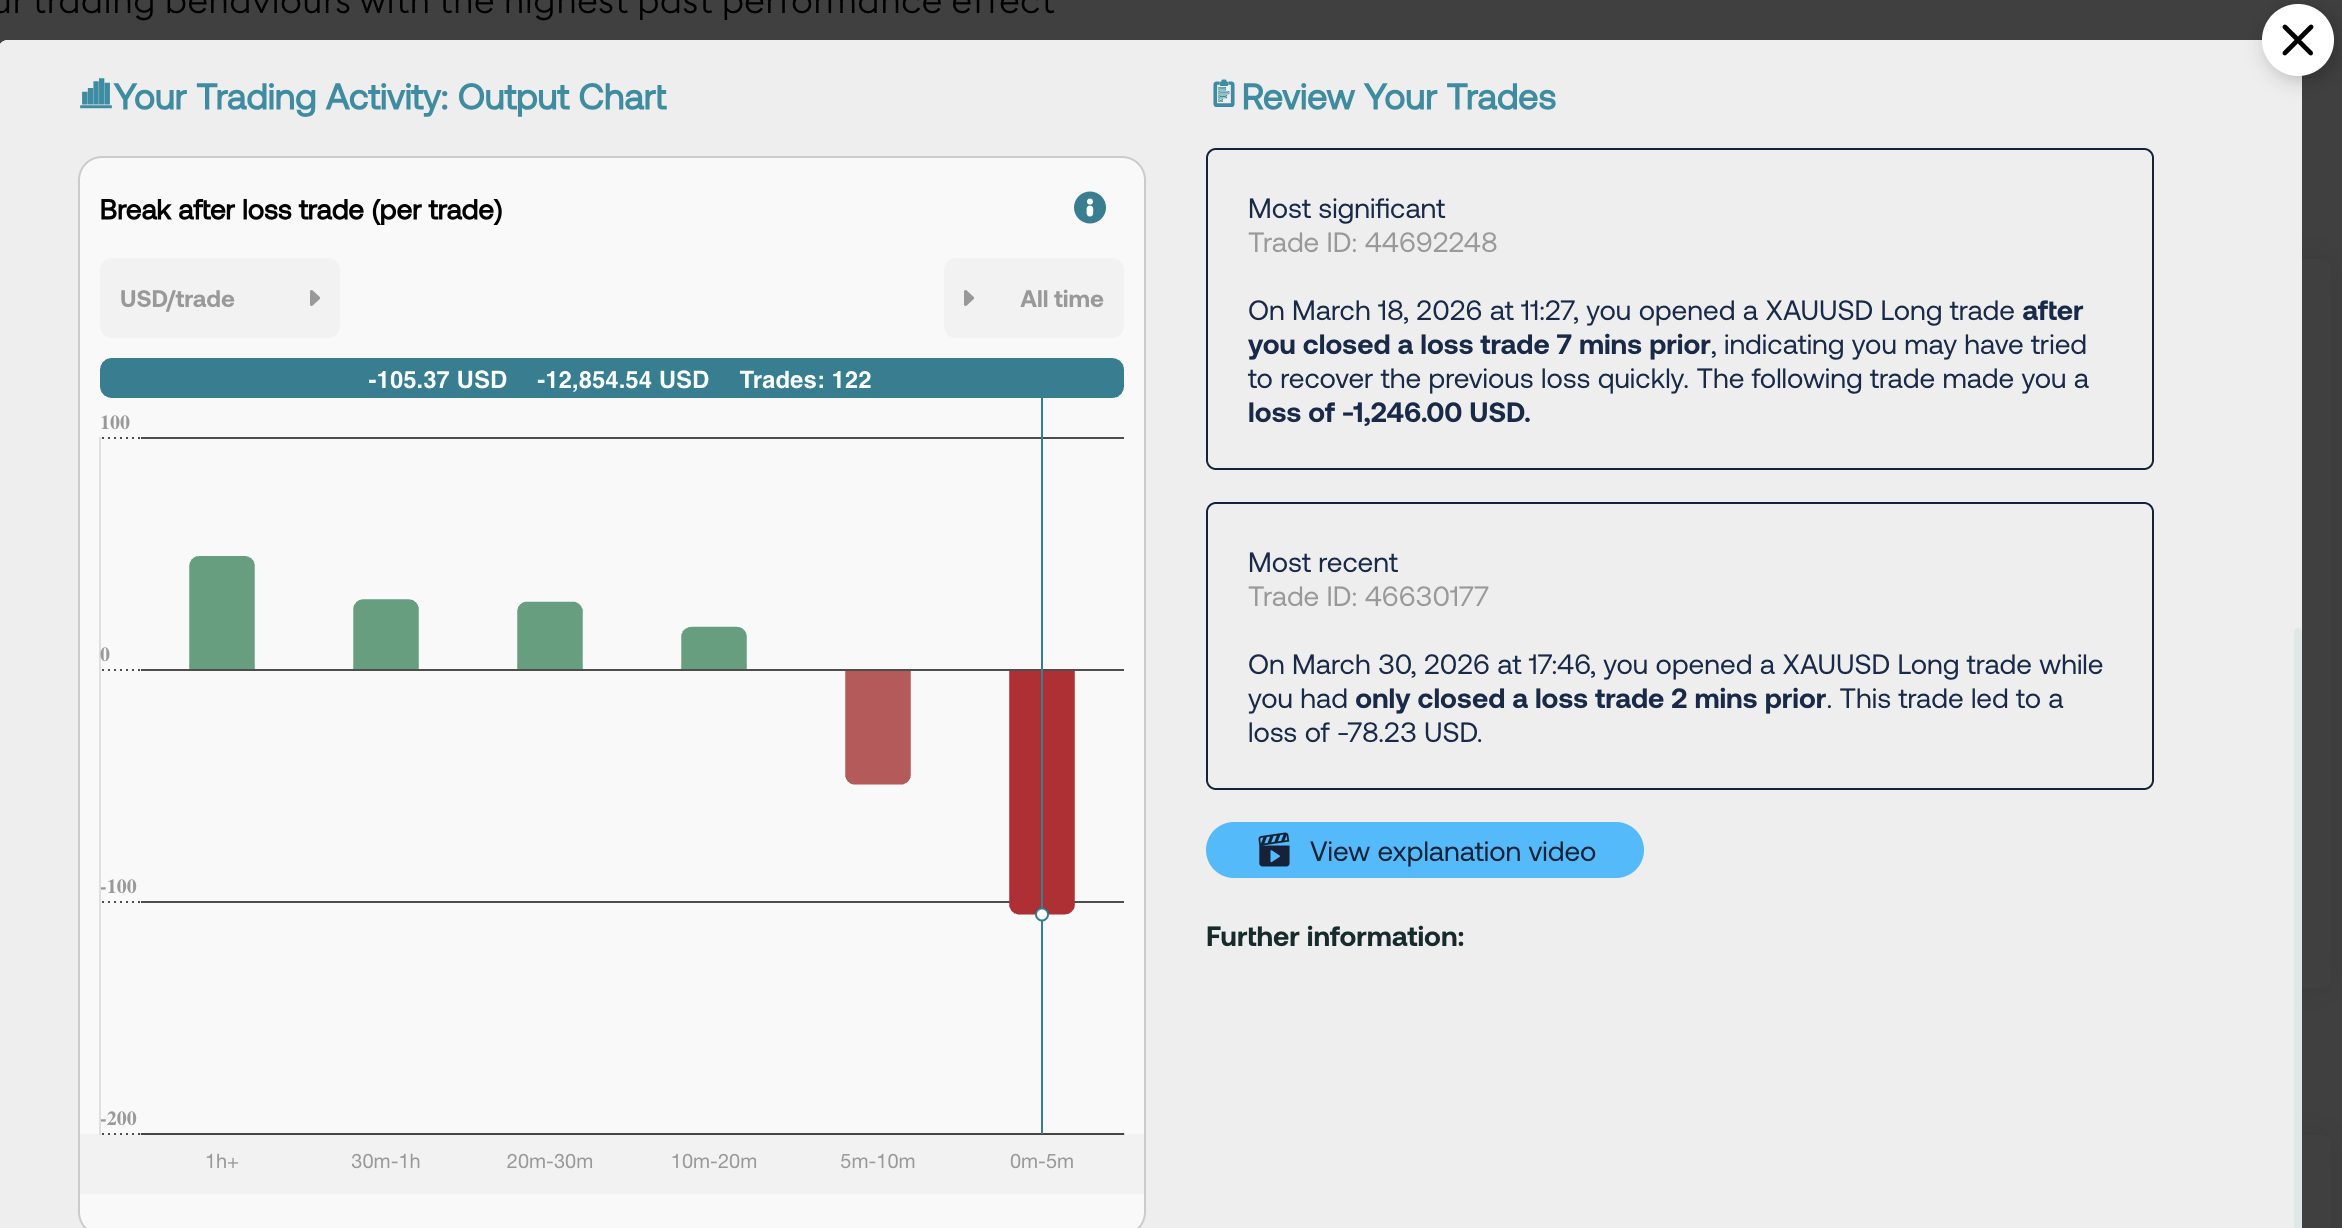
Read it left to right and the relationship is hard to miss. The shorter the break after a loss, the worse the result. Trades opened more than an hour after a loss are the strongest. Results stay positive through the 30 minute to 1 hour band, the 20 to 30 minute band and the 10 to 20 minute band, then cross into negative territory at 5 to 10 minutes and fall sharply below that. In trades this trader took within 0 to 5 minutes after a loss, the trader averaged a loss of 105.37 USD per trade across 122 trades, for a total of 12,854.54 USD.
That gradient is what flags the account for revenge trading in the first place. The system is not checking your trades against a fixed rule about how long to wait. It is checking whether break length and results move together in your data. Where they do, and where the relationship is strong enough to be worth reporting, it works out where the line sits, which trades fell on the wrong side of it, and what they came to.
You are not being measured against a generic rule. The bands come out of your own activity, so what you are comparing is your fastest re-entries against your slower ones. Each pattern also carries a short explanation video if you want the concept, possible mitigation actions, and more psychology background.
The real trades behind every finding
This is the part that separates a behavioural report from a horoscope.
Under each pattern, the report names specific trades. Not a category of trades, not a summary. Two are shown: the most significant example, and the most recent one. For revenge trading in this account they read:
Most significant, trade ID 44692248. On March 18, 2026 at 11:27, a XAUUSD long opened seven minutes after closing a losing trade. That trade lost 1,246.00 USD.
Most recent, trade ID 46630177. On March 30, 2026 at 17:46, a XAUUSD long opened two minutes after closing a losing trade. That trade lost 78.23 USD.
You can check them. Pull trade 44692248 up in your Metatrader, look at what you did and what the market was doing, and decide for yourself whether the label fits. That is the point. A finding you can verify against your own order history is a different thing from a finding you simply have to accept or not.
The pairing is deliberate, because the most significant trade shows you the worst instance, so the size of the problem is concrete. The most recent one answers a different question: is this still happening. In this account the answer is yes. The most recent example came twelve days after the most damaging one, and it sits in the fastest band of all, two minutes after a loss. There are dedicated views in the report to track this behavior over time, but more in this further below.
Because the report is live, this is the section worth returning to. The next time you place a trade that meets the pattern, it appears here as the most recent example within the report itself. If you are working on revenge trading, this is where you find out whether the work has taken hold, without waiting for a monthly review.
The same view for a strength and for a different kind of issue
Two more findings from the same account show what this looks like across different pattern types.
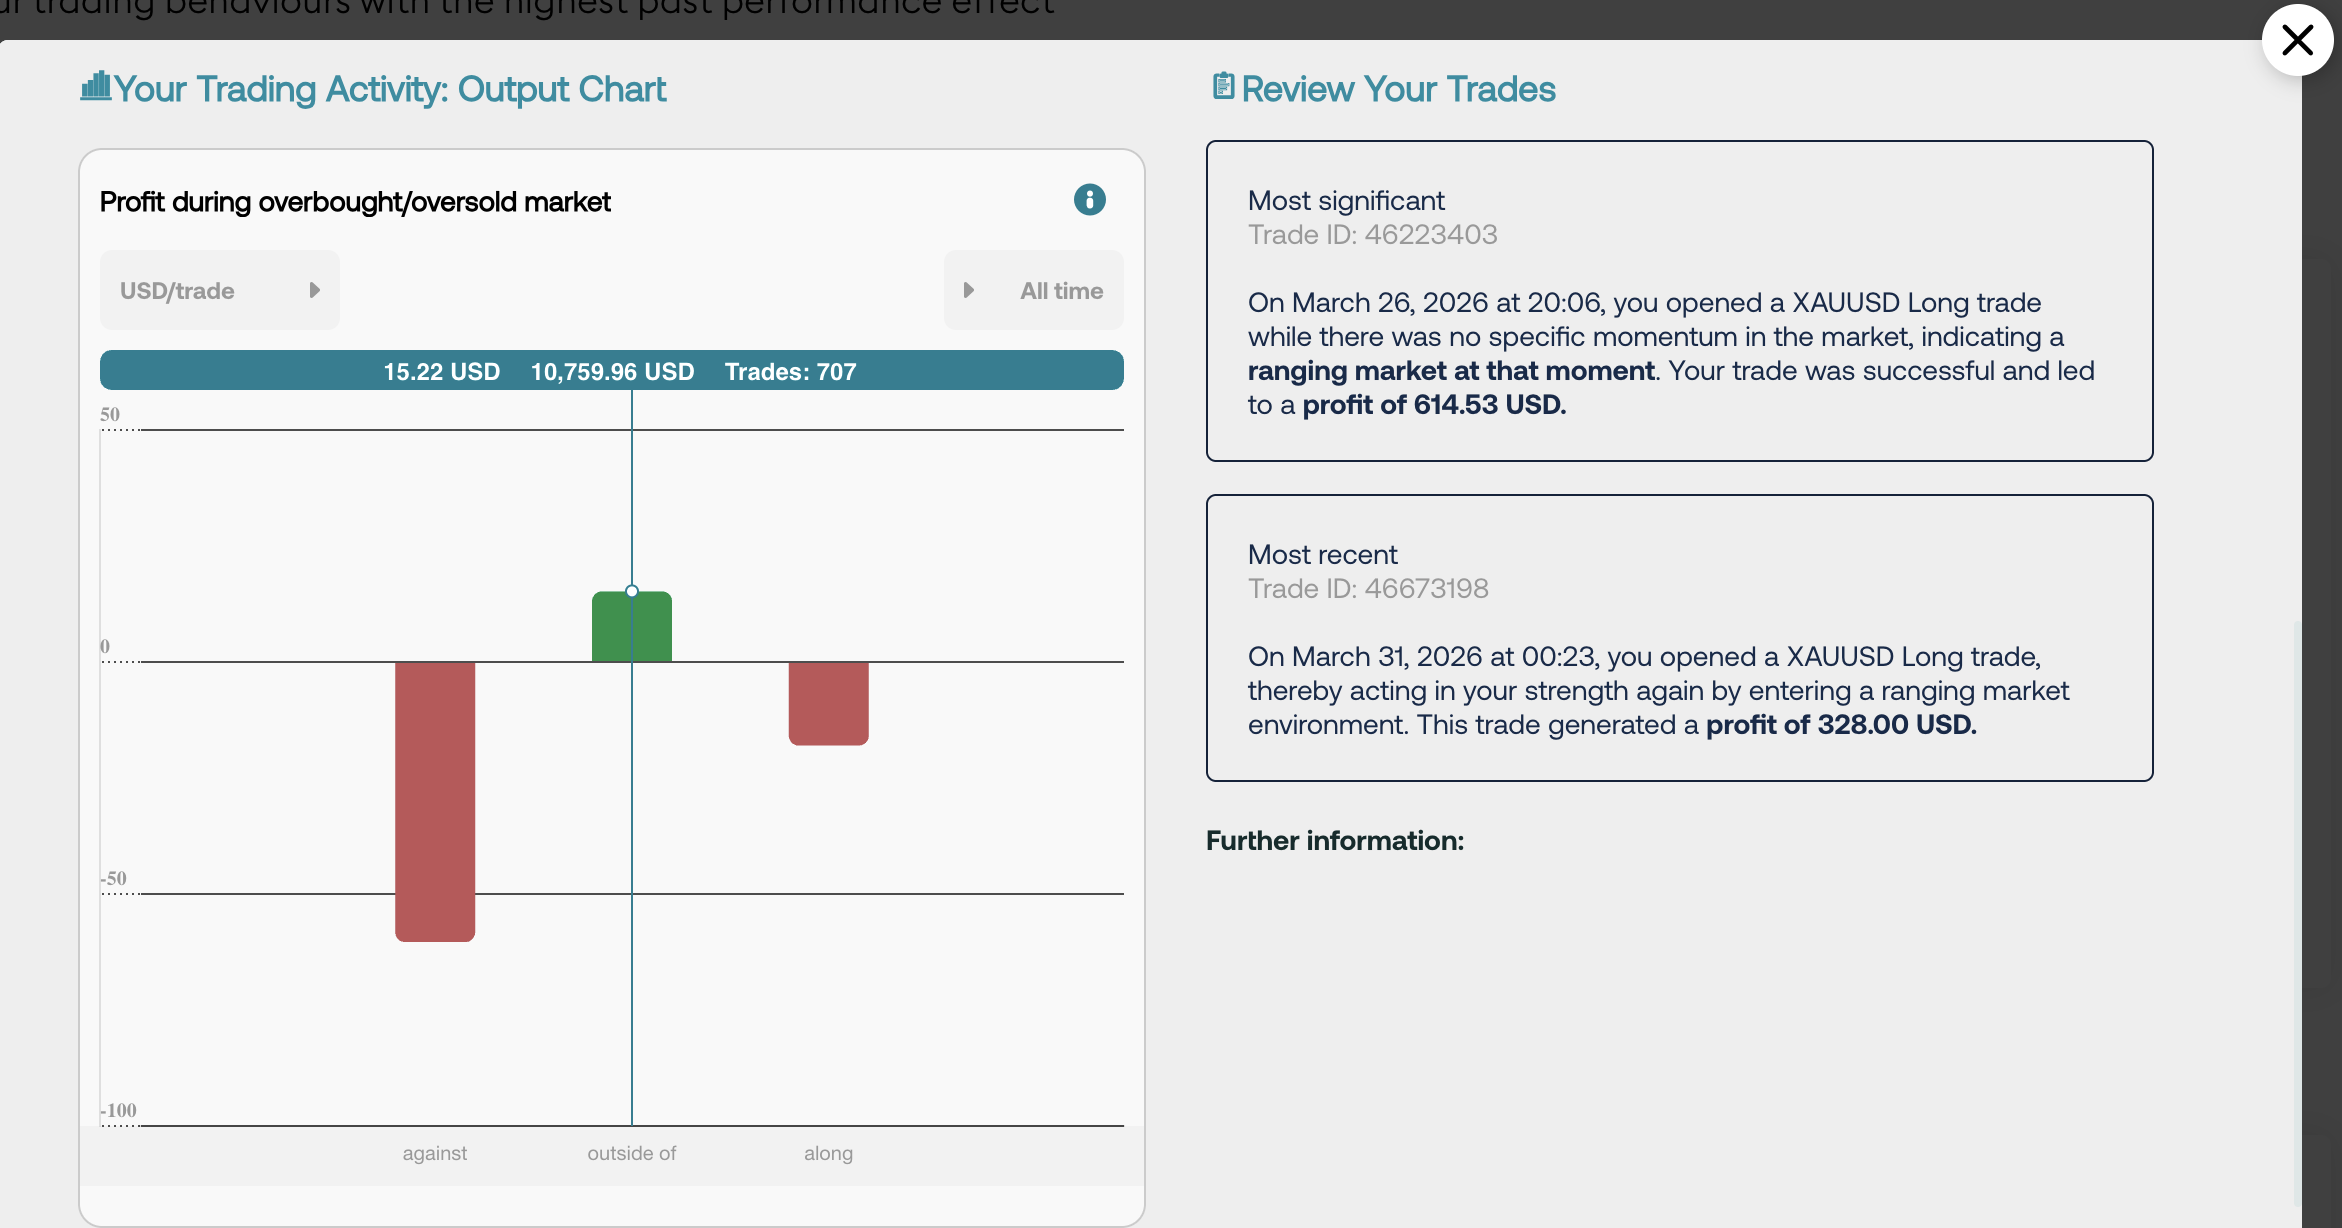
Trade Ranging Markets is a strength, filed under strategic strengths, worth 10,759.96 USD. Its summary reads:
"You've shown to strive in ranging markets, with 180 trades that were opened outside strong market momentum generating a total profit of 10,759.92 USD. It appears you perform well when there is no major momentum in the market, but you can trade a range in between a support and resistance level."
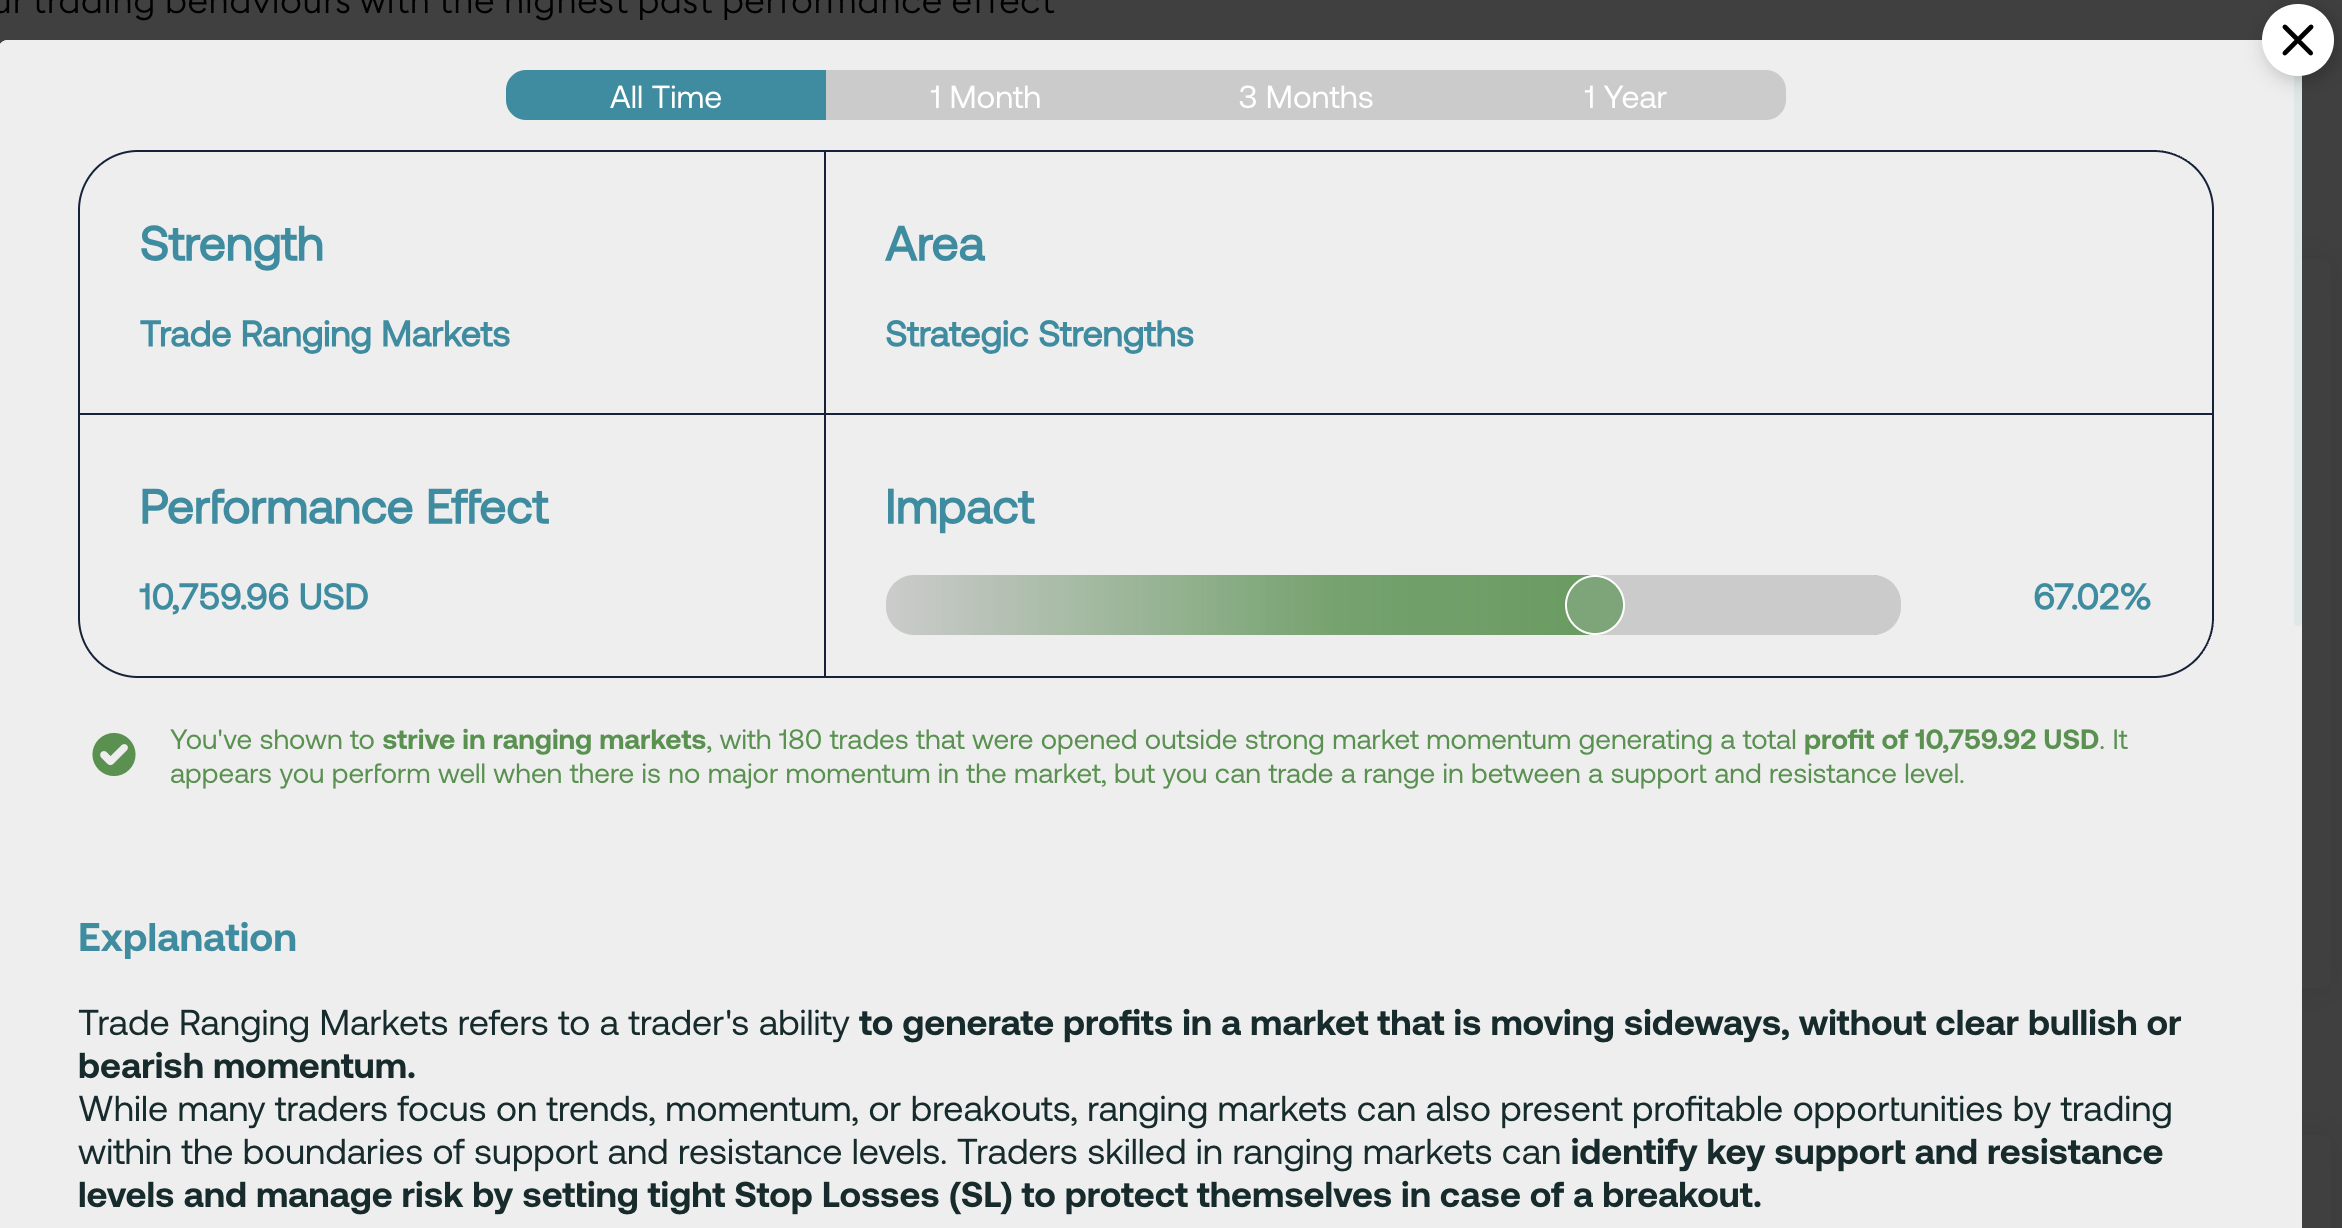
Its chart splits the trades three ways by how the entry sat relative to market momentum, measured by RSI: against it, ou
tside of it, and along with it. Only the middle group made money. Entries against momentum lost. Entries along with momentum lost. Entries taken when there was no strong momentum either way returned 10,759.96 USD.
Which hands this trader something their platform will not tell them: on this dimension, trading only outside strong market movement would have turned a losing trader into a profitable one. That is a condition they can apply to their next trade, and it came out of their own order history rather than out of general advice. Again, doing more of what you are good at already may be easier than trying to fix an issue.
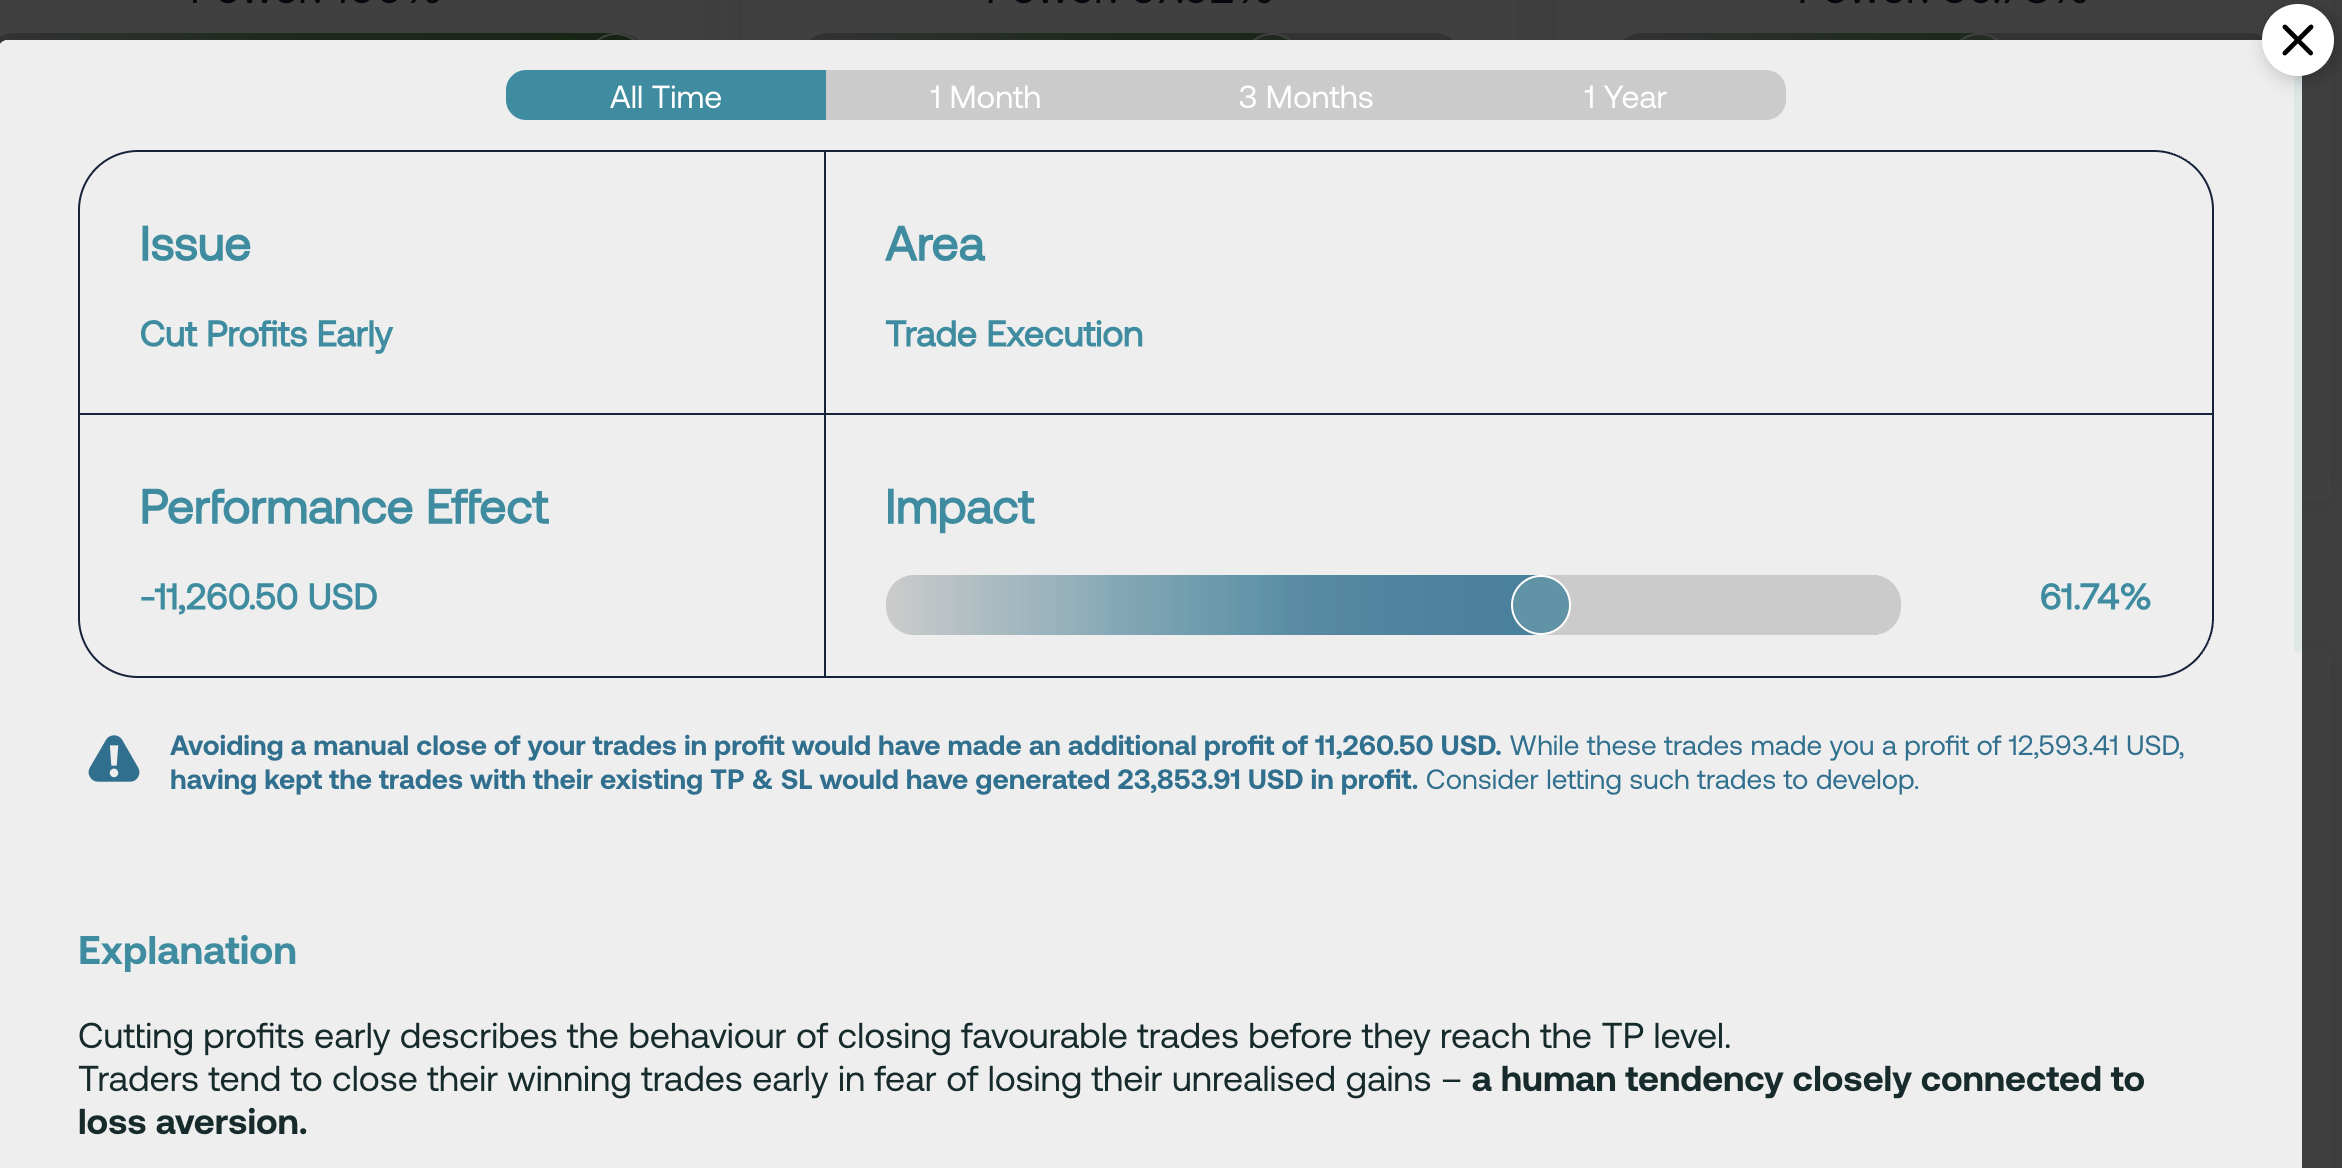
Cut Profits Early is the third type, and the number means something different: See the summary sentence below, which reads:
"Avoiding a manual close of your trades in profit would have made an additional profit of 11,260.50 USD. While these trades made you a profit of 12,593.41 USD, having kept the trades with their existing TP and SL would have generated 23,853.91 USD in profit."
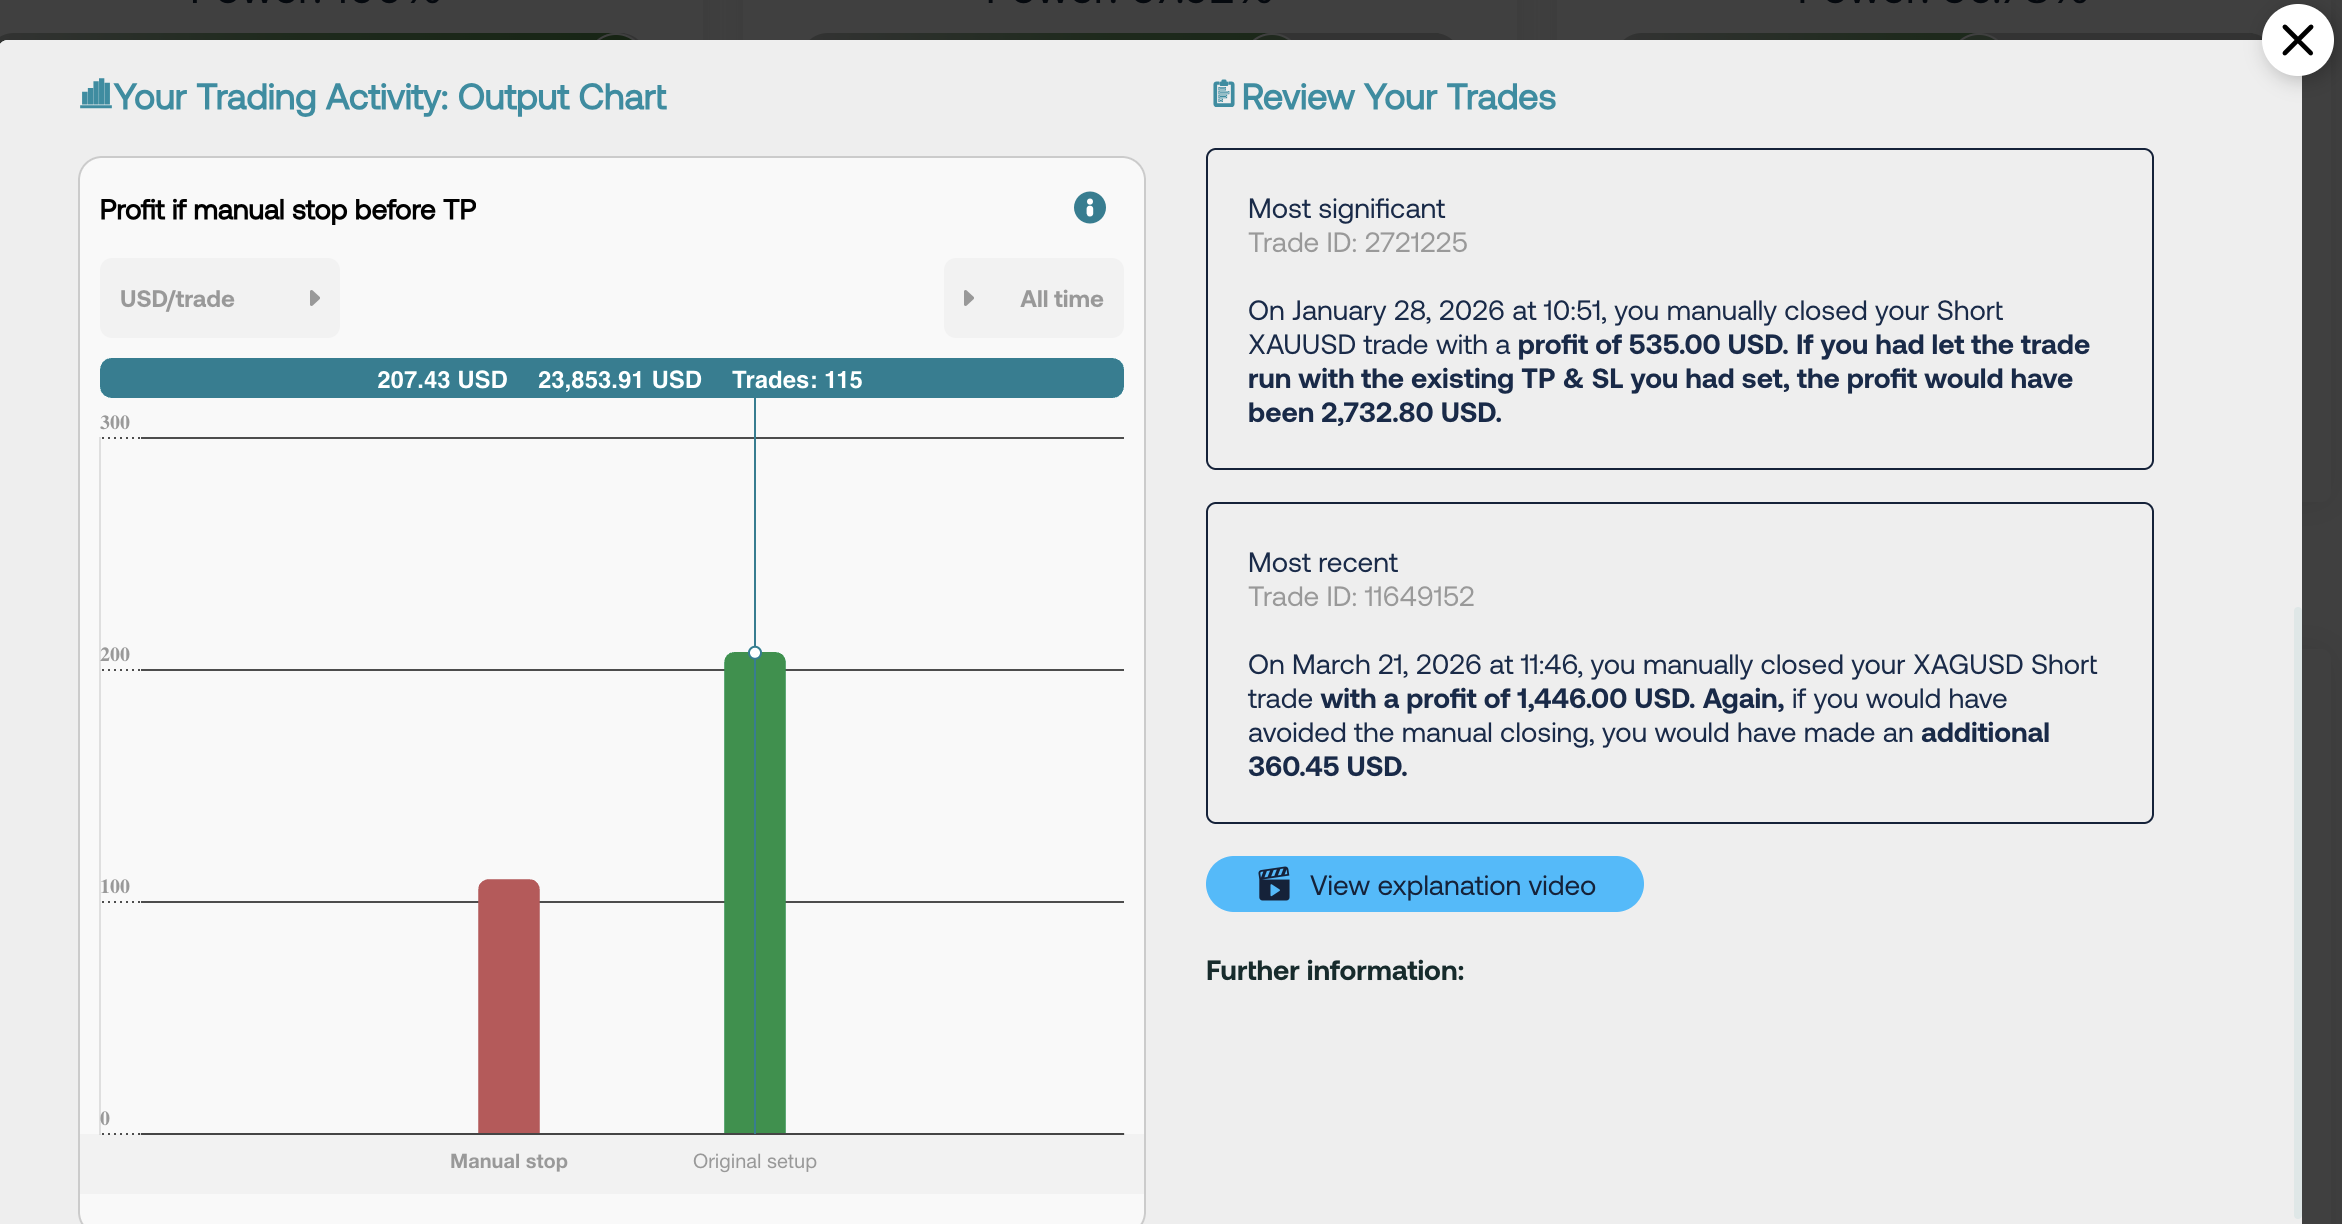
Nothing was lost in those trades. All 115 of them made money, but there is easy upside potential. The chart shows two bars and both are positive: closing manually averaged around 110 USD per trade, letting the original take profit and stop loss run would have averaged 207.43 USD. The trader collected 12,593.41 USD of an available 23,853.91 USD.
The fix is about as simple as a finding gets. Stop closing those trades by hand and let the take profit you had already set do its job.
That comparison exists because the system re-runs your trades under different behaviour. It takes the positions you closed manually, applies the take profit and stop loss you had already placed on them, and works out what they would have returned. Not a hypothetical strategy laid over your account, but your own orders with one decision removed.
It would not have been the better choice on every single trade. Some of those manual closes will have saved money on positions that later turned. The finding is about the pattern across all 115 of them, and across all 115 letting them run would have left this trader better off.
What each trading behaviour cost or made you
Every detected pattern carries a performance effect in dollars (or whatever currency your account is in), taken from your own trades.
The full report lists all of them (up to 6 per side), strengths and improvement opportunities in separate tables, each with an impact bar and a dollar figure. In this account, there were additional improvement opportunities besides the Top3 shown on top: Impatient Entries minus 7,002 USD, News Trading minus 6,202 USD, Overoptimism minus 3,944 USD.
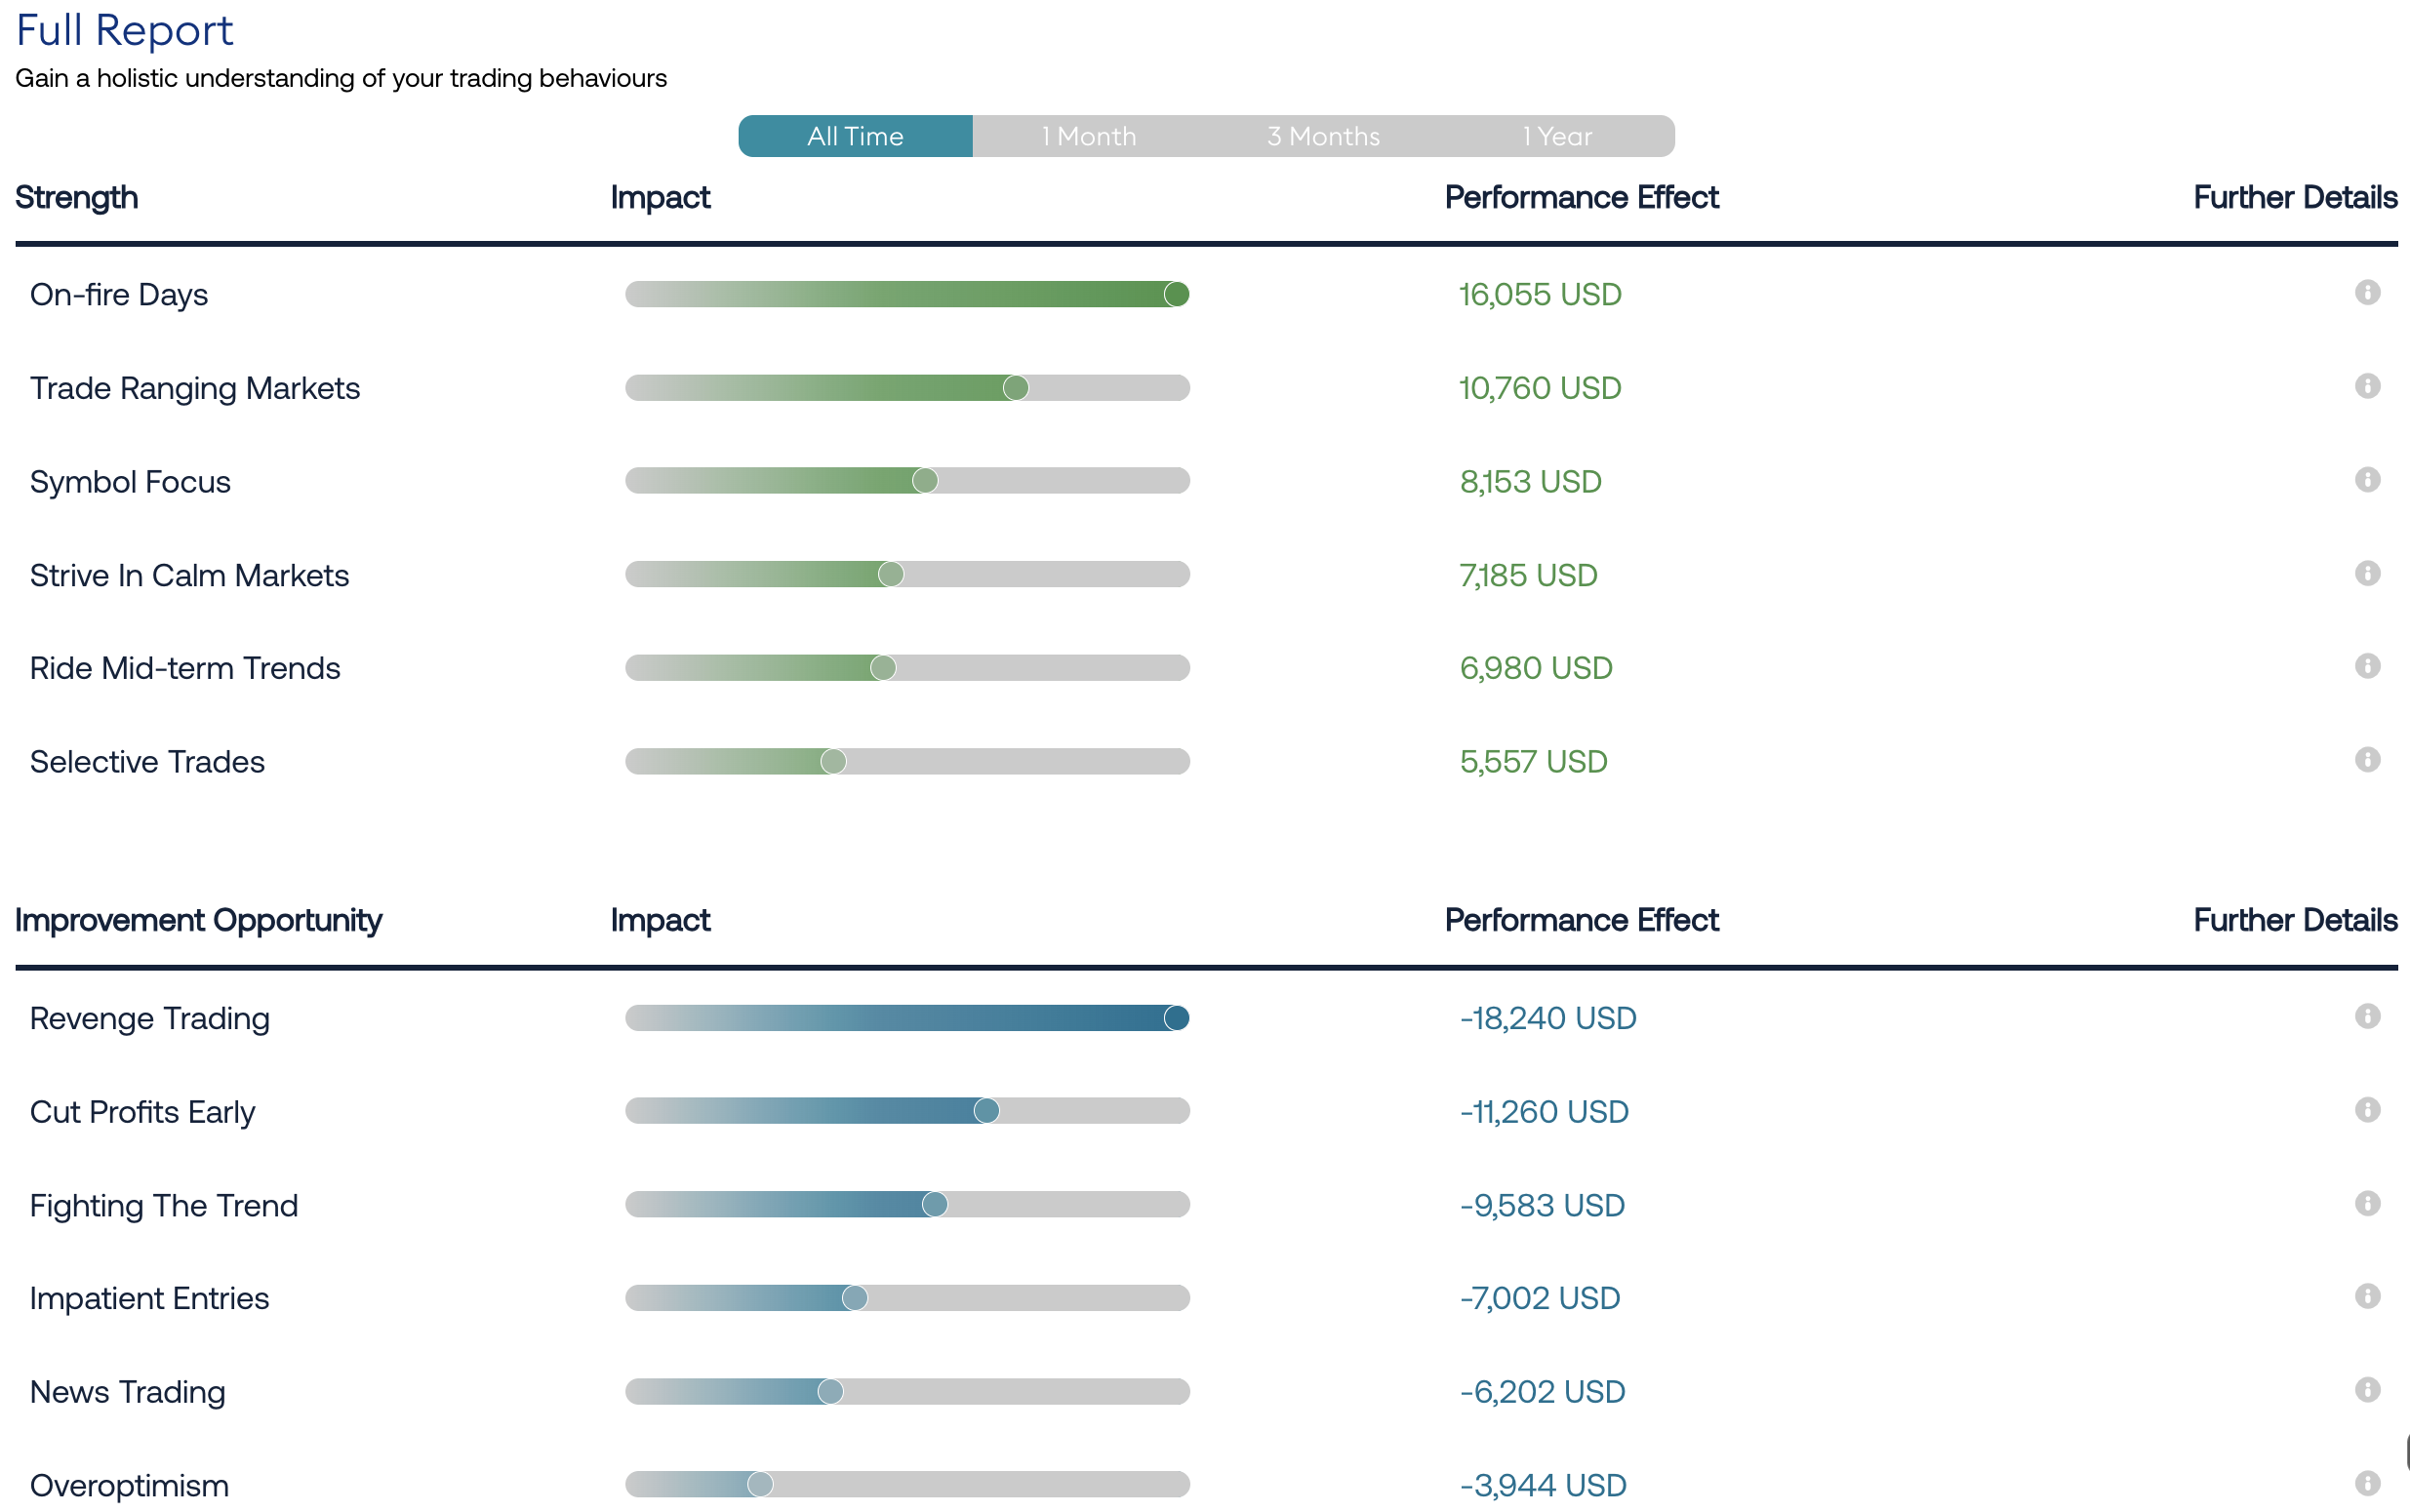
The size of those figures is a function of how much this account trades. At 4,654 trades across 193 trading days, roughly twenty-four trades a day, effects accumulate faster than they would in an account placing a few trades a week. What carries across is not only the magnitude but also the order. A trader with a tenth of the activity can still have revenge trading as their most expensive habit, at a tenth of the dollar value.
One distinction inside those numbers is worth understanding, because it changes what the figure means.
Revenge Trading at minus 18,240 USD is capital that left the account. Cut Profits Early at minus 11,260 USD is not. As the detail view showed, those 115 trades all made money. The figure is the gap between the 12,593 USD collected and the 23,854 USD that was available in positions the trader had already entered correctly. The same applies to the impatient entries. All are worth fixing. They are not the same kind of number, and treating forfeited upside as money lost would overstate what happened.
The same table can be filtered to all time, the last year, the last three months or the last month, which is where the numbers start telling you about direction rather than history.
Which trading habit to fix first
This is the question the report exists to answer, and it is the one most traders cannot answer on their own.
The patterns are ranked by the size of their effect. In this account the ranking is unambiguous. Revenge Trading at minus 18,240 USD is roughly 60% larger than the second item and nearly double the third. It is also a loss-type pattern rather than forfeited upside, which means the capital is gone rather than uncollected. Both the size and the type point the same way, so revenge trading is the first thing this trader should work on.
Compare that with how the same trader would have chosen without the ranking. Fighting The Trend is the pattern that feels worst in the moment, because you watch the position move against you for hours. Cut Profits Early is the one that produces the most regret afterwards. Neither is the largest number. Discomfort and cost are not the same measure, and without the quantification you optimise for the wrong one.
One caveat that belongs here rather than in a footnote. Removing a pattern does not add its dollar figure back to the account. The number tells you the size of the relationship the system found between that behaviour and this trader's results. It is a ranking instrument, not a forecast, and treating it as a promise of recovered profit would be reading more into it than the method supports.
How your numbers compare to other traders
A dollar figure on its own tells you the size of something. It does not tell you whether it is normal.
The detection thresholds behind the report are built from behavioural analysis across more than 500,000 trader accounts, which is what allows a pattern to be identified as a pattern rather than as a run of bad luck. That population also provides the context for how common a behaviour is and how it tends to relate to results.
Revenge trading appears among the top five improvement opportunities for roughly 16% of traders in that population. Among traders where it ranks as the single largest issue, 13.4% are profitable, against a baseline of 18.2% across all traders analysed. Those are population figures rather than statements about any individual account, and they describe an association rather than a cause.
Which areas of your trading need work
Individual patterns tell you what to fix. The 8-point assessment tells you where the problem lives.
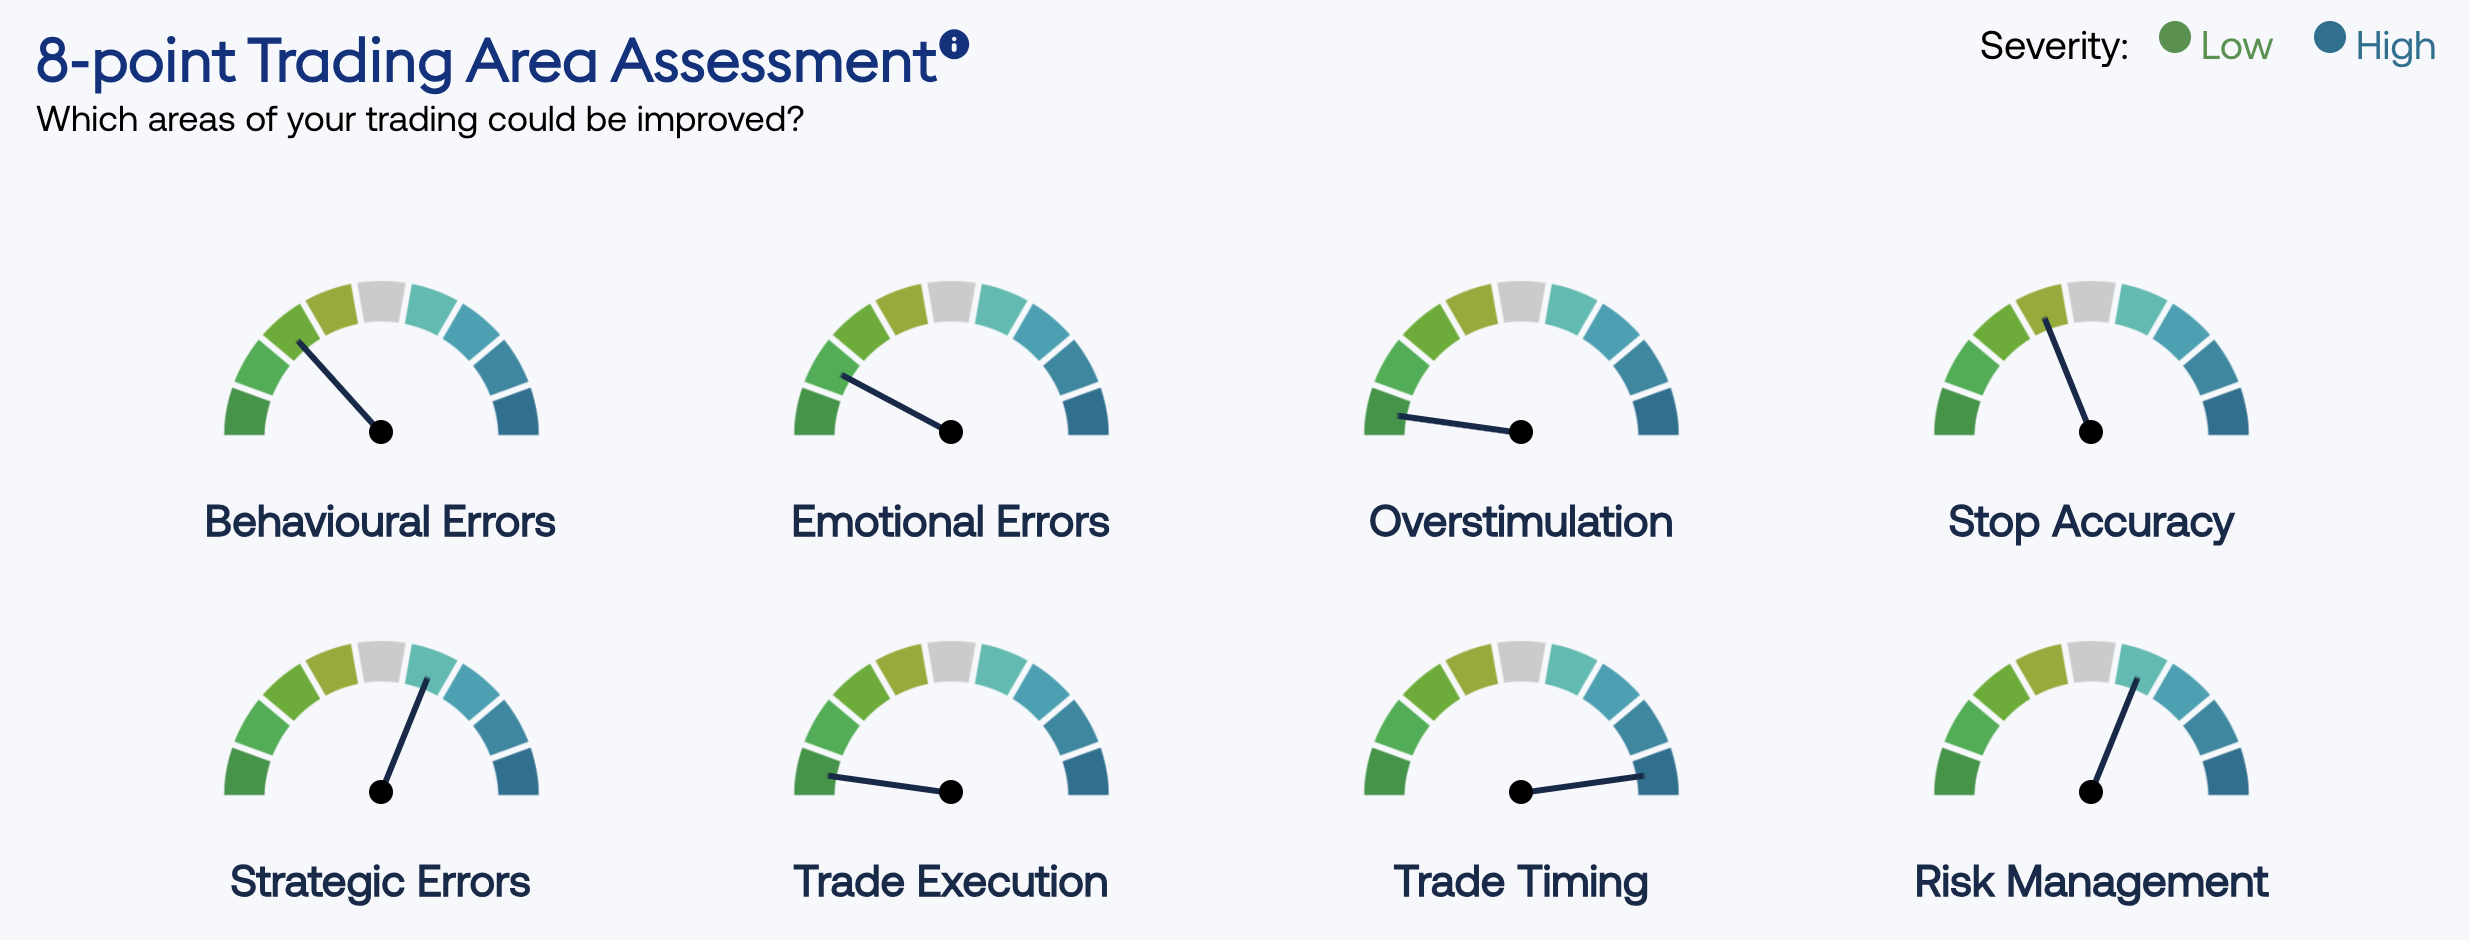
Eight areas are scored on a low to high severity scale: Behavioural Errors, Emotional Errors, Overstimulation, Stop Accuracy, Strategic Errors, Trade Execution, Trade Timing and Risk Management. Each is shown as a gauge, so you can see at a glance whether your issues are concentrated in one area or spread thinly across several.
That distinction changes what you do next. A trader whose severity sits almost entirely in one area has a specific problem to solve. A trader with moderate readings across five areas has something broader going on, and that trader needs to work on these one after the other.
Where risk is building before it costs you
Most behavioural patterns erode an account slowly. A small number end it.
The Risks and Further Observations section is separate from the pattern list for that reason. It checks the mechanisms that protect an account rather than the ones that shape performance: whether risk per trade climbs during losing streaks, whether outsized single positions appear, how consistently stops are used, whether risk per trade stays within sane limits, and how average wins compare with average losses.
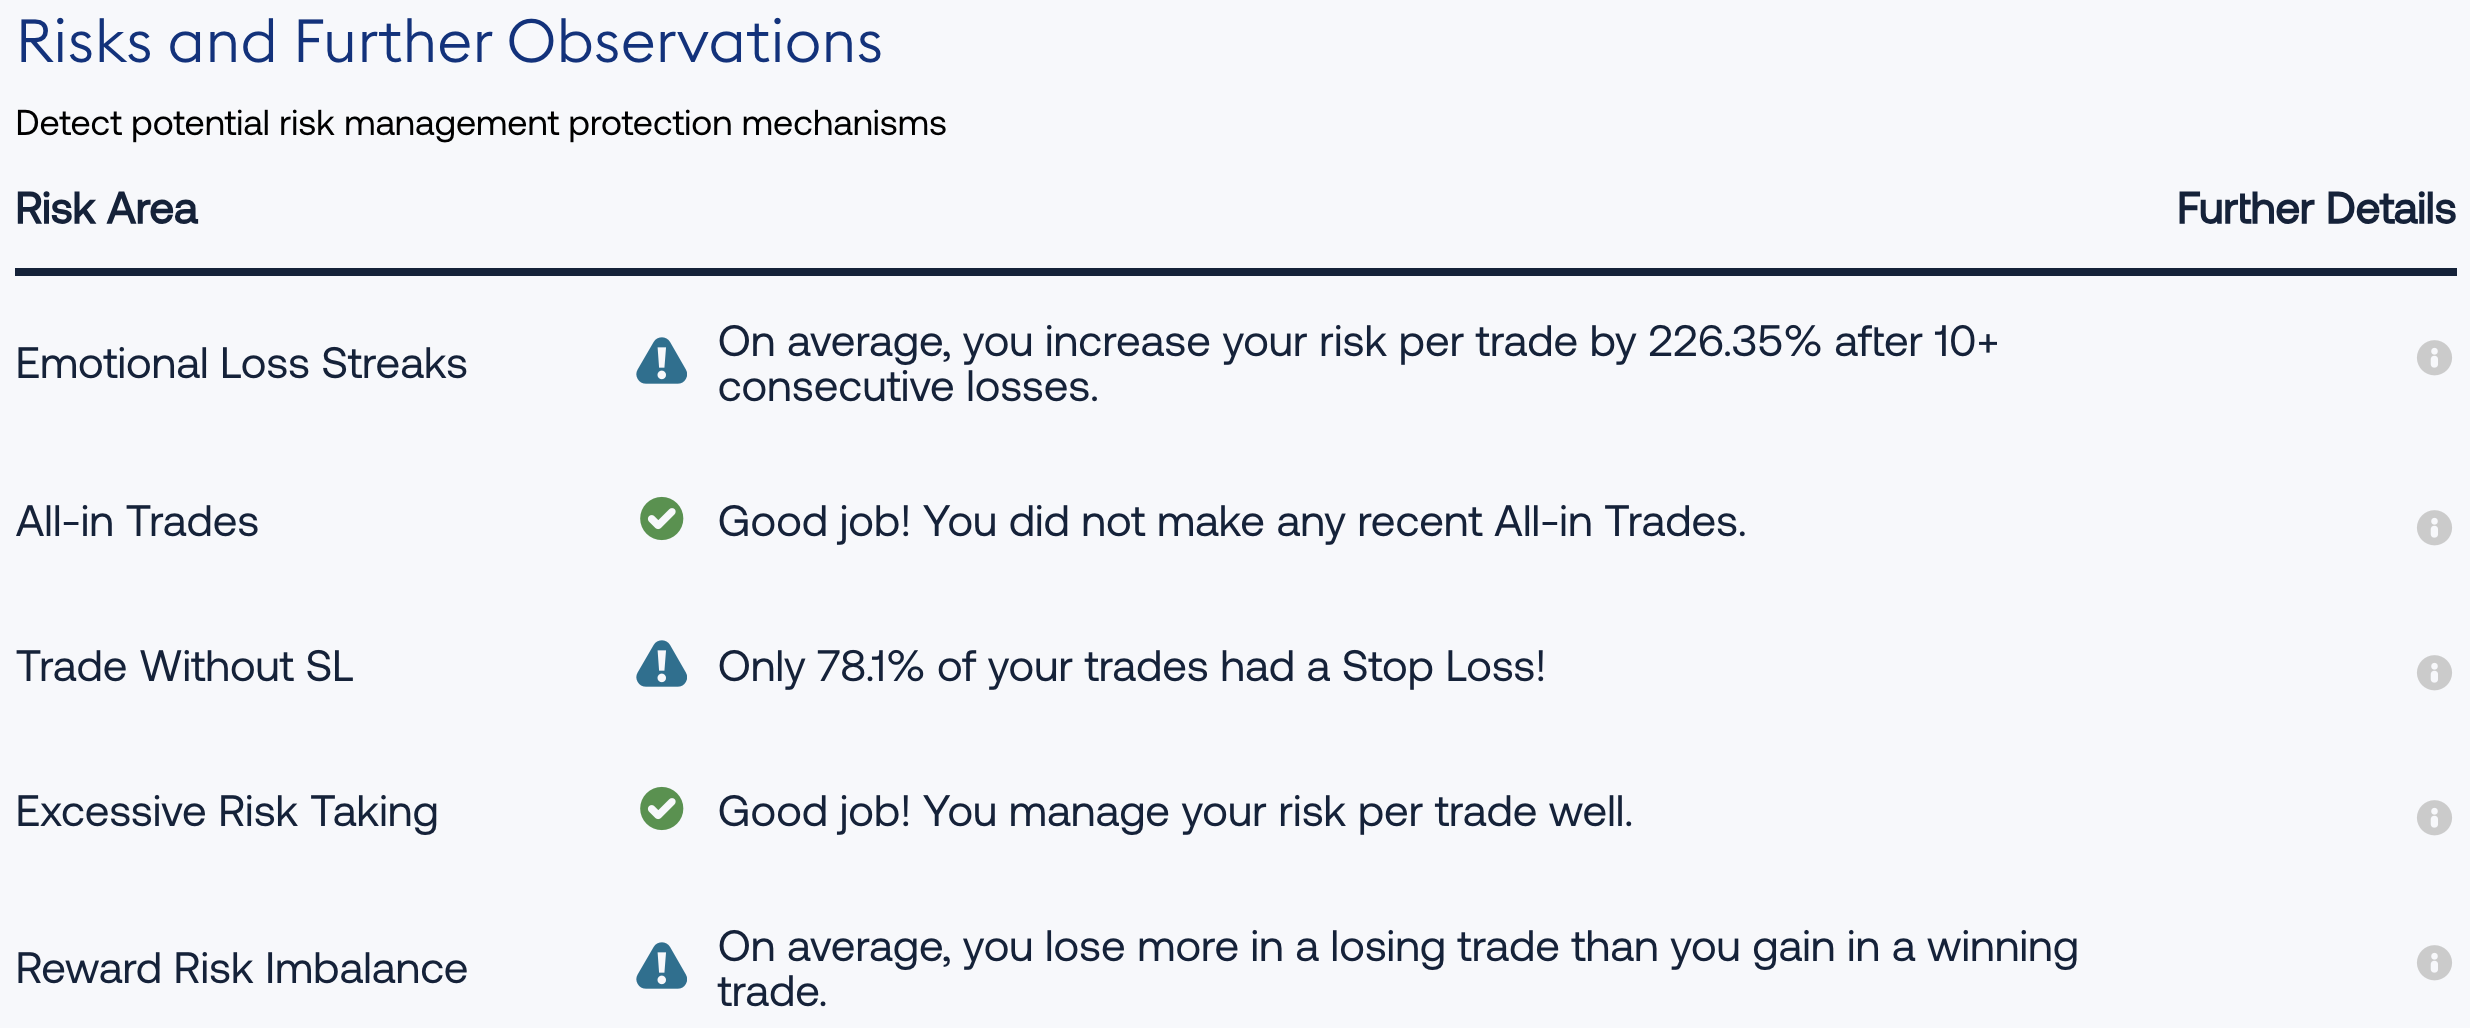
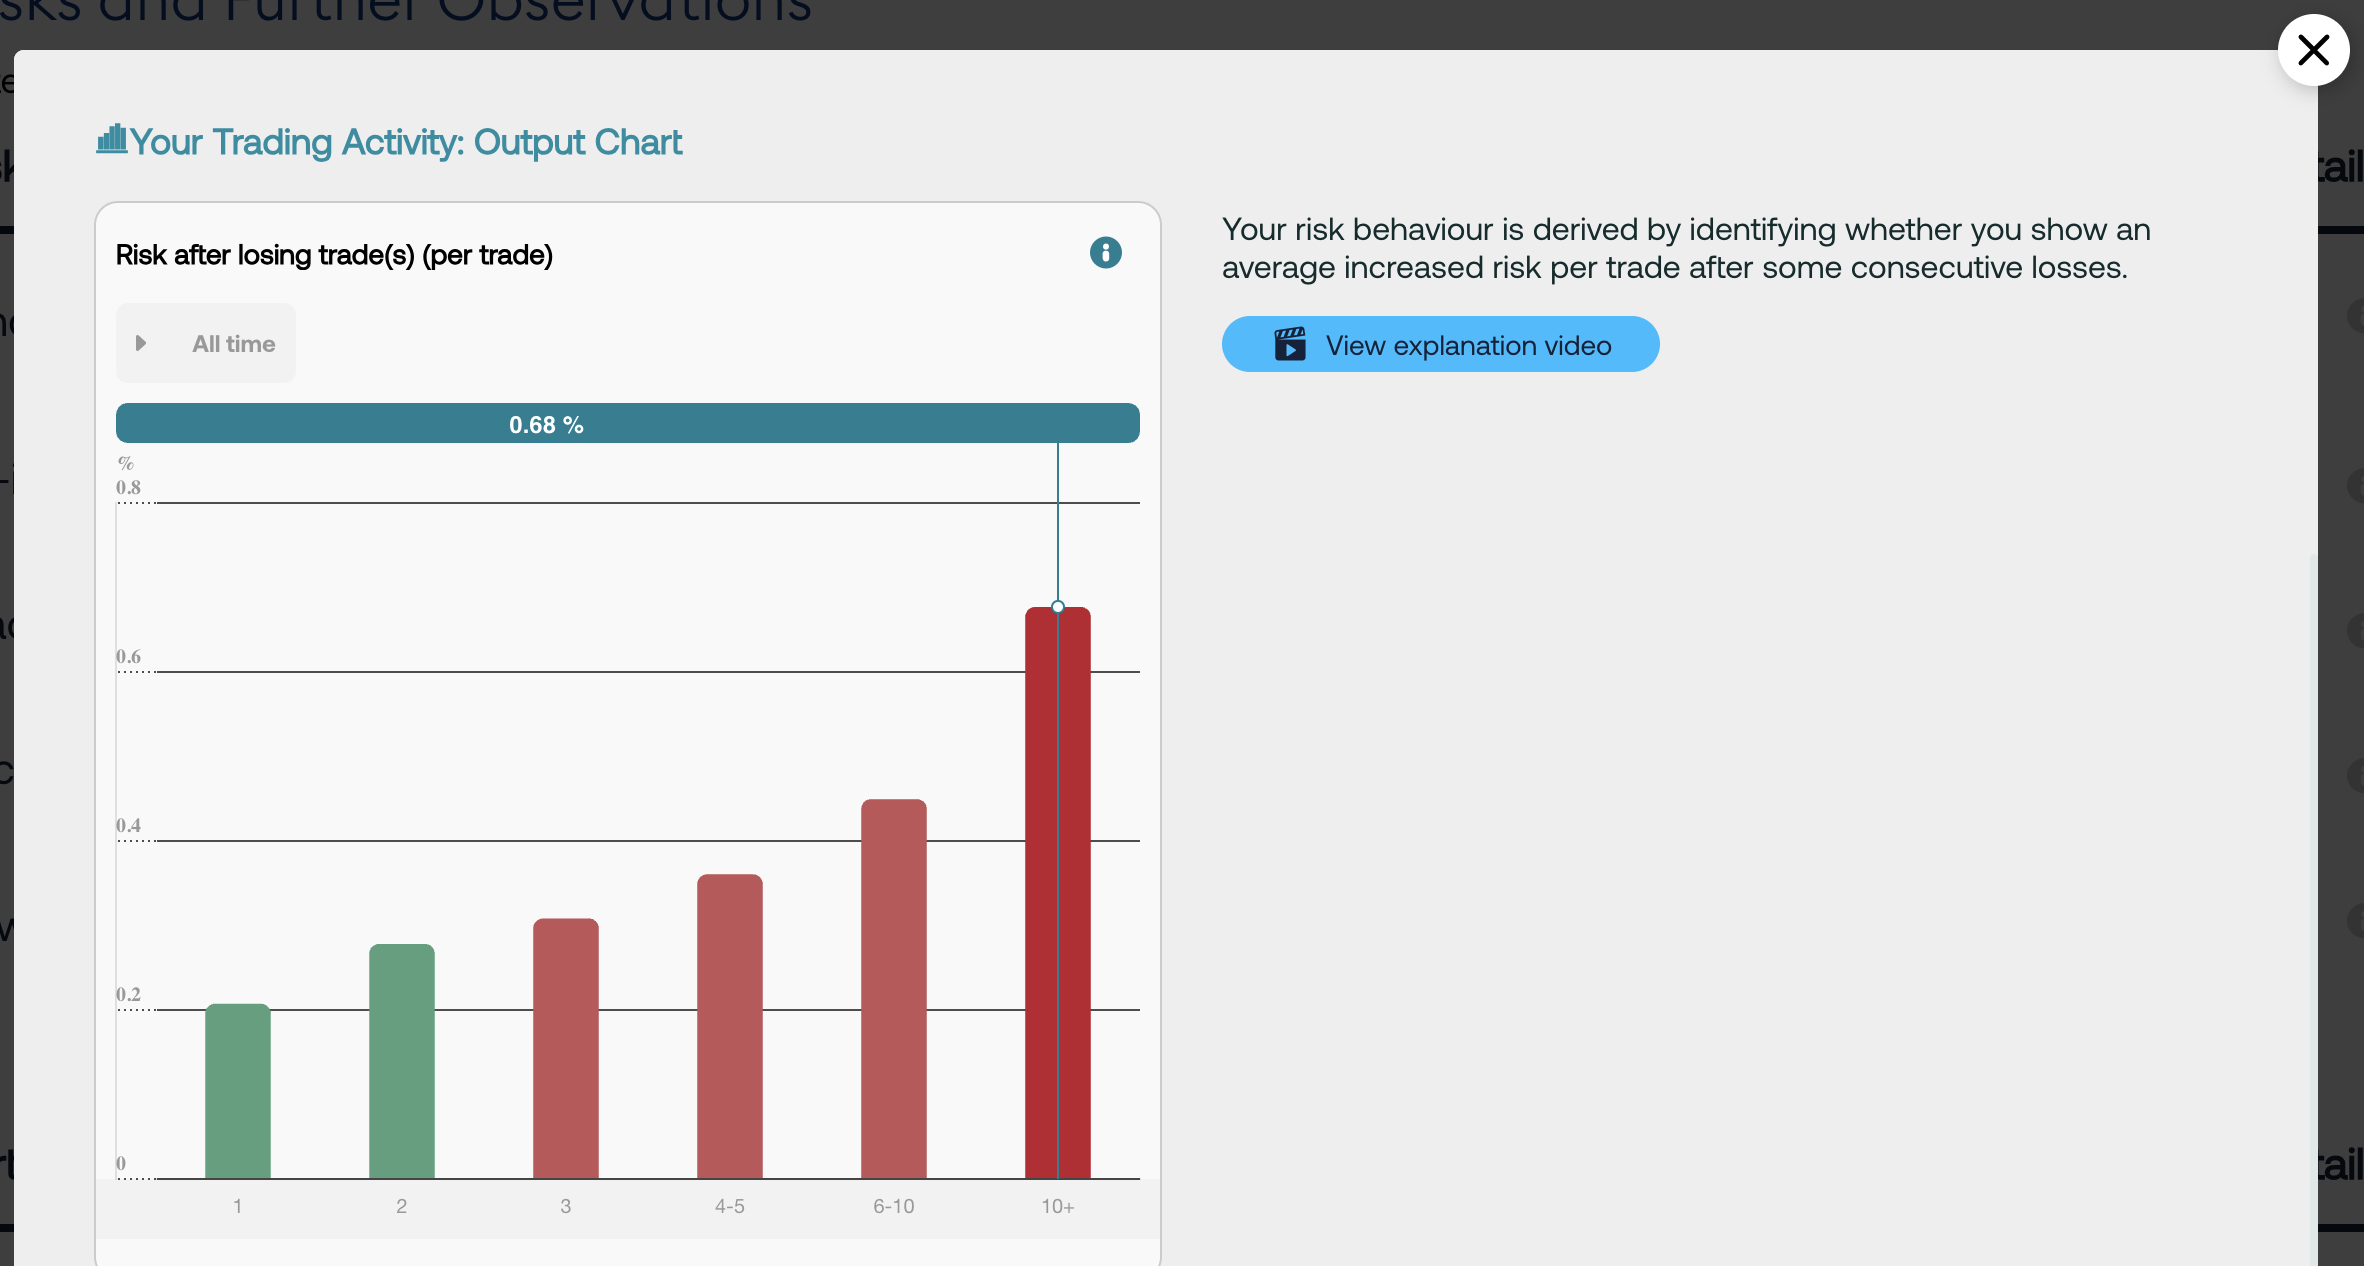
In this account it reads like this. Risk per trade rises by 226.35% on average after ten or more consecutive losses. Clicking on the info button opens up the details on this, and you can see how this trader slowly increases the risk per trade during loss streaks.
Only 78.1% of trades carried a stop loss. Average losses are larger than average wins. Against those three, two come back clean: no recent all-in trades, and risk per trade is well managed under normal conditions.
The green results carry information too. Knowing that your position sizing is sound under normal conditions tells you the problem is specific to losing streaks rather than general, and that is a narrower thing to fix.
Whether your trading is improving
Every strength and improvement opportunity is also shown across four windows: all time, the last twelve months, the last three months and the last month. This is the section that answers whether the work is working.
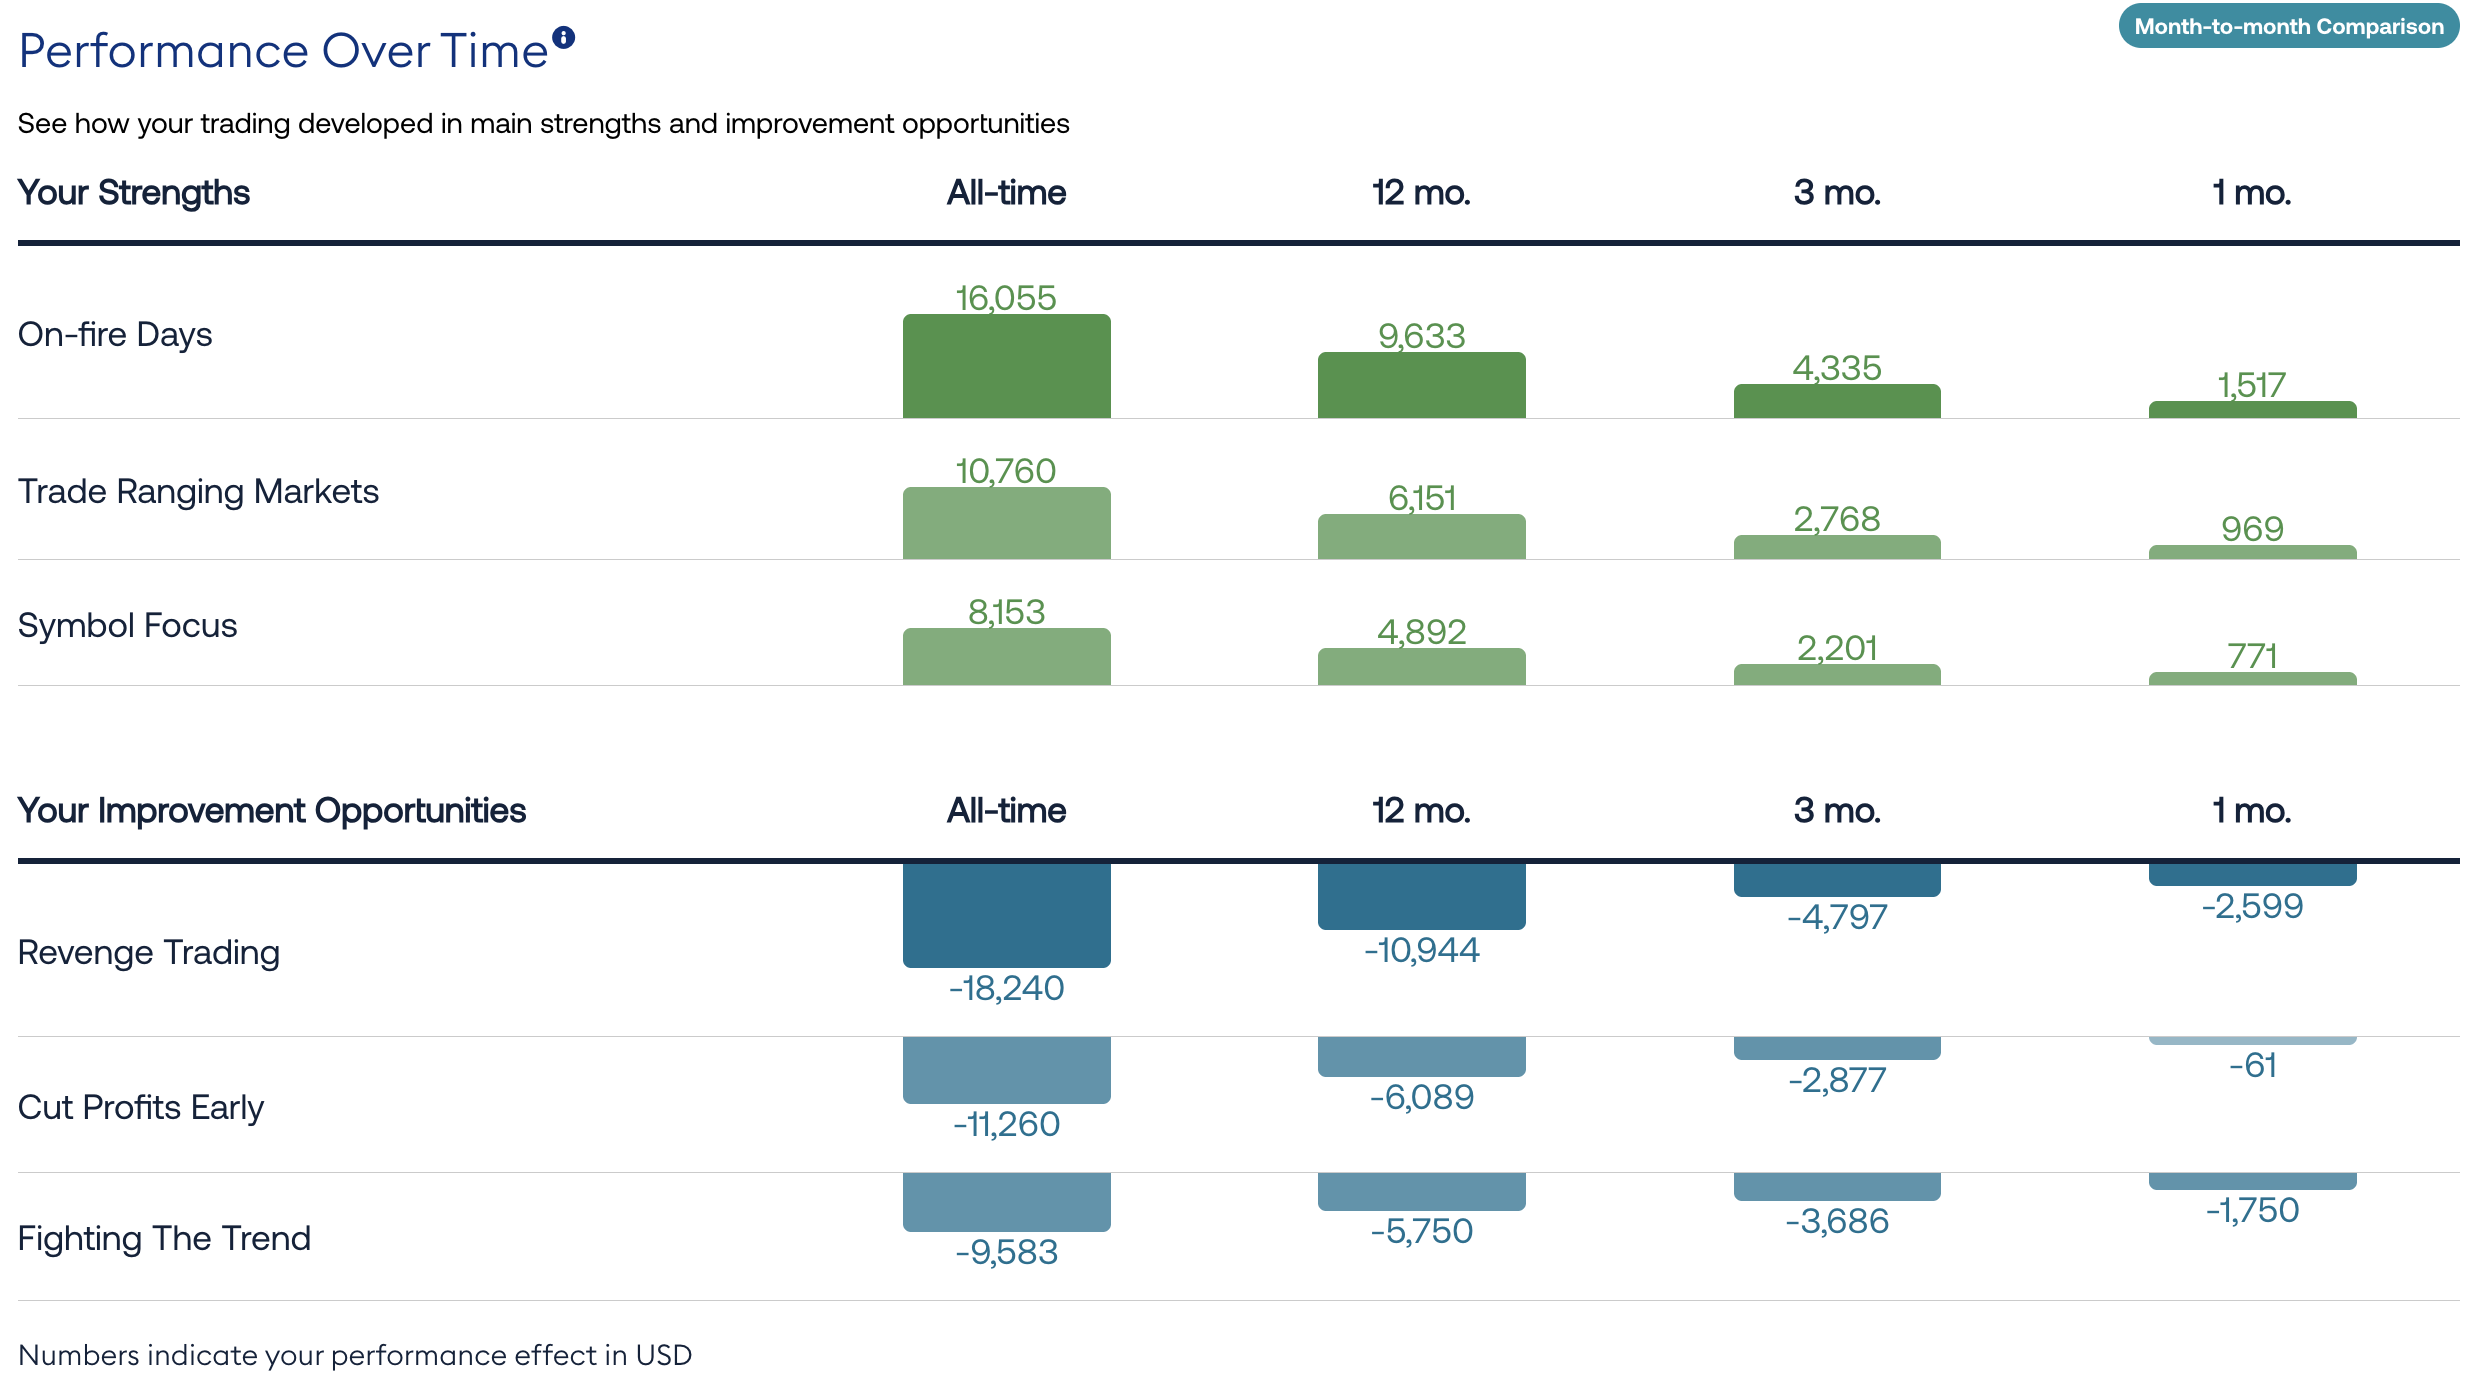
This account shows two opposite trajectories side by side.
Revenge Trading is getting worse. Of the 4,797 USD it accounts for across the last three months, 2,599 USD falls in the most recent month alone. More than half of a three-month effect landing in the latest month is not a habit fading out.
Cut Profits Early is going the other way. It accounts for 2,877 USD across the last three months, but only 61 USD of that is in the most recent month. Something in how this trader manages exits has changed, and the report shows it before the equity curve would.
Moreover, you can also compare your performance month-by-month to see your performance change in items you’ve worked on in the last month, or also the month before that.
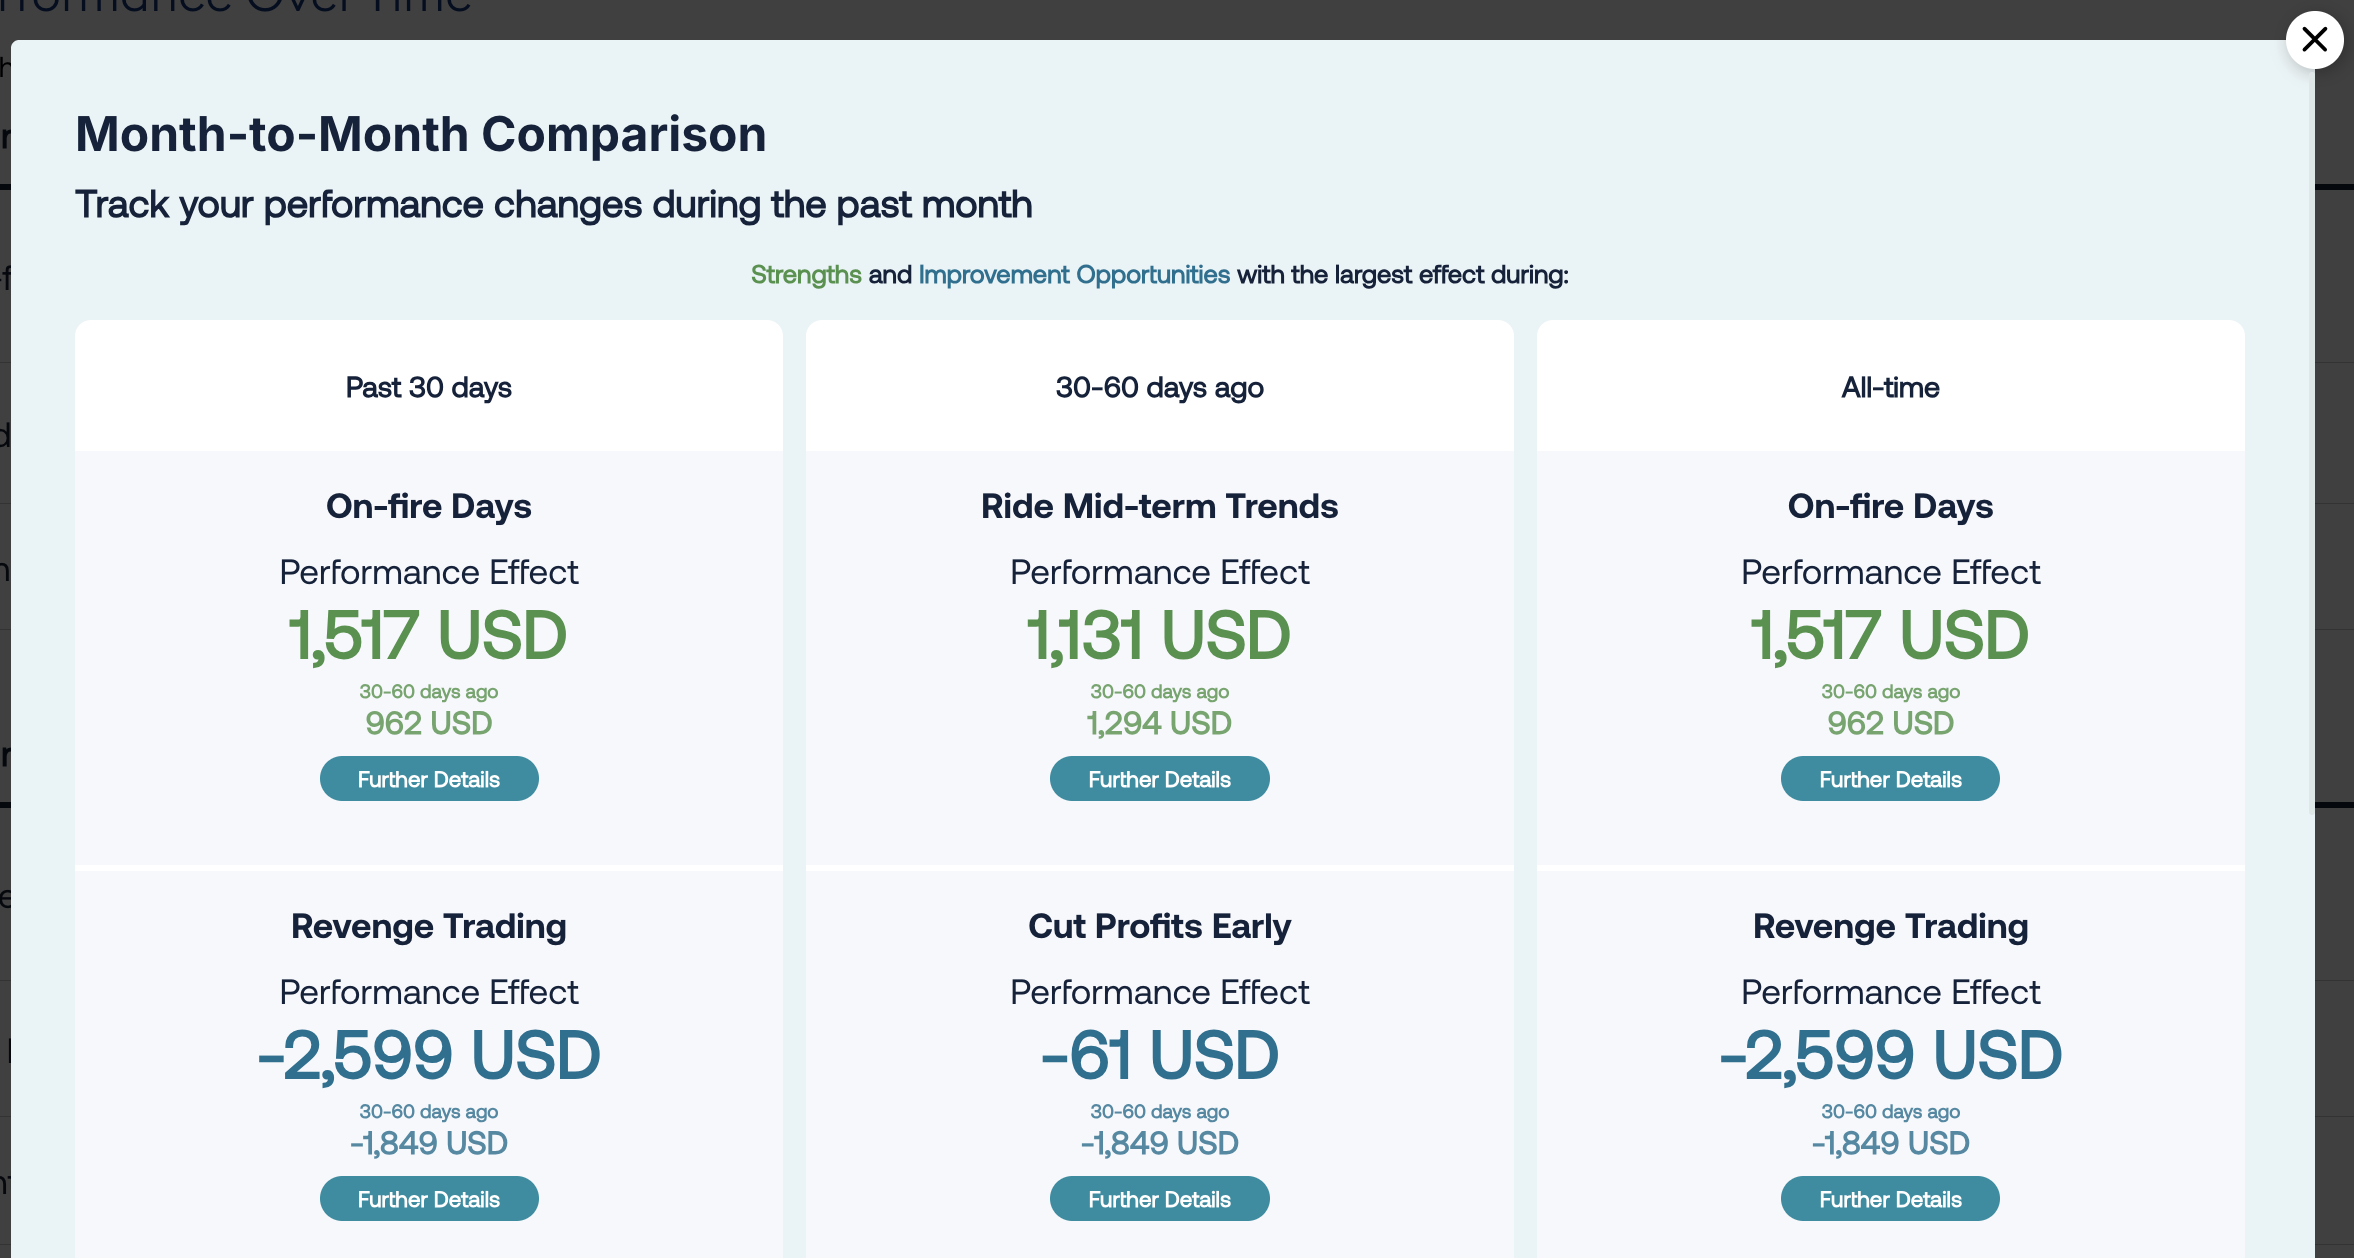
Neither of those readings would be visible in a monthly profit and loss figure. A good month can hide a worsening habit, and a bad month can hide a habit you have already fixed. Splitting the account by behaviour rather than by outcome is what makes the direction legible.
Does this work for the way I trade?
Yes, and across more than one account.
Live broker accounts, past accounts and prop firm challenge accounts can all be connected, including challenges that ended some time ago. Merging them gives you the behavioural picture across your trading rather than across one funding arrangement, which matters if the habit you are trying to break followed you from a blown challenge into a live account. You can still open each account on its own, since you may be running different strategies on each.
The thresholds adjust per account as well. If you scalp on one account and swing on another, each is assessed against the way it is traded rather than against a single rule applied to both.
What the TradeMedic report does not do
It does not tell you what to trade. There are no signals, no entries, no price targets and no market forecasts anywhere in the report.
It does not place or modify trades. The connection is read only.
It does not predict your future results. Every figure describes a relationship found in trades you have already placed.
And the relationships it finds are correlations rather than proven causes. The report shows that certain conditions accompanied certain results in your history. It is diagnostic work, and like any diagnostic it is a starting point for a decision rather than the decision itself. Lastly, none of the information provided are financial advice and there may be errors.
The bottom line
Knowing your bad habits is not the same as knowing which one to deal with. The report exists to turn a vague sense that something is off into a ranked list with dollar figures attached, backed by the specific trades that produced them.
Learn more about how TradeMedic AI works, or connect a trading account free and see which patterns appear in your own history to level up your trading.
Frequently asked questions
What does the TradeMedic report show?
The report shows the behavioural patterns detected in your trade history, split into strengths and improvement opportunities, each with a dollar figure showing its effect on your results. It also includes an eight area severity assessment, a set of risk checks covering stop loss usage and risk escalation, real trade examples for every pattern, and a view of how each pattern has developed over the last month, three months and year.
Does TradeMedic work with MT4 and MT5?
Yes. You connect an MT4 or MT5 account using an investor password, which gives read only access and cannot place or close trades. Your full existing trade history is analysed as soon as the account is connected.
Does TradeMedic work with prop firm accounts?
Yes. Prop firm challenge accounts can be connected in the same way as live broker accounts, including accounts from challenges that have already ended. Multiple accounts can be merged into one behavioural picture.
How does TradeMedic decide which trading habit to fix first?
Each detected pattern is assigned a dollar effect calculated from your own trades, and the patterns are ranked by the size of that effect. The largest figure is the behaviour with the strongest measured relationship to your results, which makes it the first candidate to work on rather than whichever habit feels most uncomfortable.
Is TradeMedic a trading signal service or a trading bot?
No. TradeMedic does not generate signals, forecast prices or place trades. It analyses how you trade, not what the market is going to do, and the account connection is read only.
How is this different from a trading journal?
A journal depends on you recording and tagging trades consistently over months, and most traders stop before the data becomes useful. TradeMedic analyses your existing trade history automatically as soon as the account is connected, detects patterns without you labelling anything, and attaches a dollar figure to each one so they can be ranked.
Is my trading data shared with AI providers?
No. Your trade summary data is not shared with third party large language model providers.
How many trades do I need in order to get a TradeMedic AI report?
You'll need 50 closed trades on the account before you can receive a report.