Trading Journal: Why Most Traders Quit and What Actually Works

You have probably been told to keep a trading journal. Every trading book says it. Every mentor recommends it. Every YouTube video about improving your trading includes it somewhere in the list. And the advice is not wrong. Understanding your own trading patterns is the foundation of improvement. The question is whether a journal is actually the best way to get there.
A significant number of traders who start journaling stop within a few weeks. Not because they lack discipline. Because the effort-to-insight ratio feels wrong. You spend fifteen minutes after each session logging entries, tagging emotions, noting your reasoning. After a month, you have a spreadsheet with hundreds of rows that you rarely review. After three months, the entries get shorter. After six months, the journal is abandoned. The traders who do persist often find that the insights are limited to things they already knew: their win rate, their average loss, which instruments they trade best.
The deeper problem is not discipline. It is that a journal can only capture what you consciously notice and choose to record. The most destructive patterns in your trading are the ones you do not see. That is not a motivation problem. It is a structural limitation of self-reported data. This article examines why traders abandon their journals, what journals structurally cannot detect in your trading data, and how automated behavioural analytics solves both problems.
What a trading journal is supposed to do
The concept behind trading journals is sound. The idea is that by recording your trades, your reasoning, and your emotional state, you create a dataset about your own behaviour that you can later analyse to find patterns. Three goals drive the practice.
The first goal is self-awareness. By writing down what you did and why, you force yourself to reflect on your decision-making rather than moving straight to the next trade. Did you follow your plan? Did you deviate? What prompted the deviation?
The second goal is pattern recognition. Over time, journal entries should reveal recurring behaviours. Maybe you always overtrade on Mondays. Maybe your largest losses happen when you enter a second position before the first one has resolved. Maybe you perform worse after a losing streak.
The third goal is behaviour change. Once you see a pattern, you can address it. The journal creates the feedback loop: observe, identify, adjust.
All three goals are valid. Self-awareness, pattern recognition, and behaviour change are exactly what separates traders who improve from traders who repeat the same mistakes for years. The question is not whether these goals matter. It is whether a manual journal is the most effective way to achieve them.
Why most traders stop journaling
The trading journal industry does not talk much about retention. Every journal app, template, and method pitches itself as the key to improvement. None of them acknowledge the elephant in the room: most traders quit.
The most obvious reason is effort. A trader taking five trades per day, five days a week, needs to log 25 trades per week. If each entry takes three minutes (trade details, emotional state, notes on reasoning, screenshots), that is over an hour of journaling per week. For a scalper taking twenty trades per day, the math becomes absurd. The journal becomes a second job that produces no immediate return.
The second reason is inconsistency in the data. You journal diligently after losses because losses sting and you want to understand what went wrong. After winning days, the motivation drops. You made money, everything feels fine, why bother logging? Over time, your journal develops a systematic bias: it overrepresents your losing trades and underrepresents your winning ones. Any analysis drawn from that dataset is skewed.
This compounds when you miss a day entirely. You meant to log your trades last night but you were tired. Two days later you cannot remember the reasoning behind Tuesday’s entries, only the outcomes. You leave the entries blank or write something vague. The dataset now has gaps. The gaps make the whole journal feel incomplete, which reduces your motivation to continue. One missed day turns into three, and by the following week the habit is broken. This dropout spiral is one of the most common reasons journals are abandoned, and it is entirely a function of the tool requiring manual effort at a specific moment in time.
The third reason is the gap between recording and analysing. Most traders who journal never do the analysis step. They log entries but never go back to review them systematically. The journal accumulates data that sits unused because the trader does not know what to look for, does not have the statistical tools to find patterns, or simply does not have the time to do the analysis on top of actually trading.
The fourth reason is the most fundamental, and it connects to the blind spot bias research. When you journal, you are the observer and the subject. You report your own emotional state, your own reasoning, your own assessment of what happened. But research consistently shows that people are poor judges of their own cognitive processes. A trader who revenge trades does not tag the entry as “revenge trade” because in the moment it felt like a rational decision based on a good setup. A trader who increases position size after losses does not write “I am falling for the gambler’s fallacy” because they genuinely believe the next trade is more likely to win. The journal captures what you believe happened, not necessarily what actually happened.
The problem journals cannot solve: you can only see what you already notice
Even a perfectly maintained journal has a structural limitation that no amount of discipline can overcome. You can only record what you are aware of.
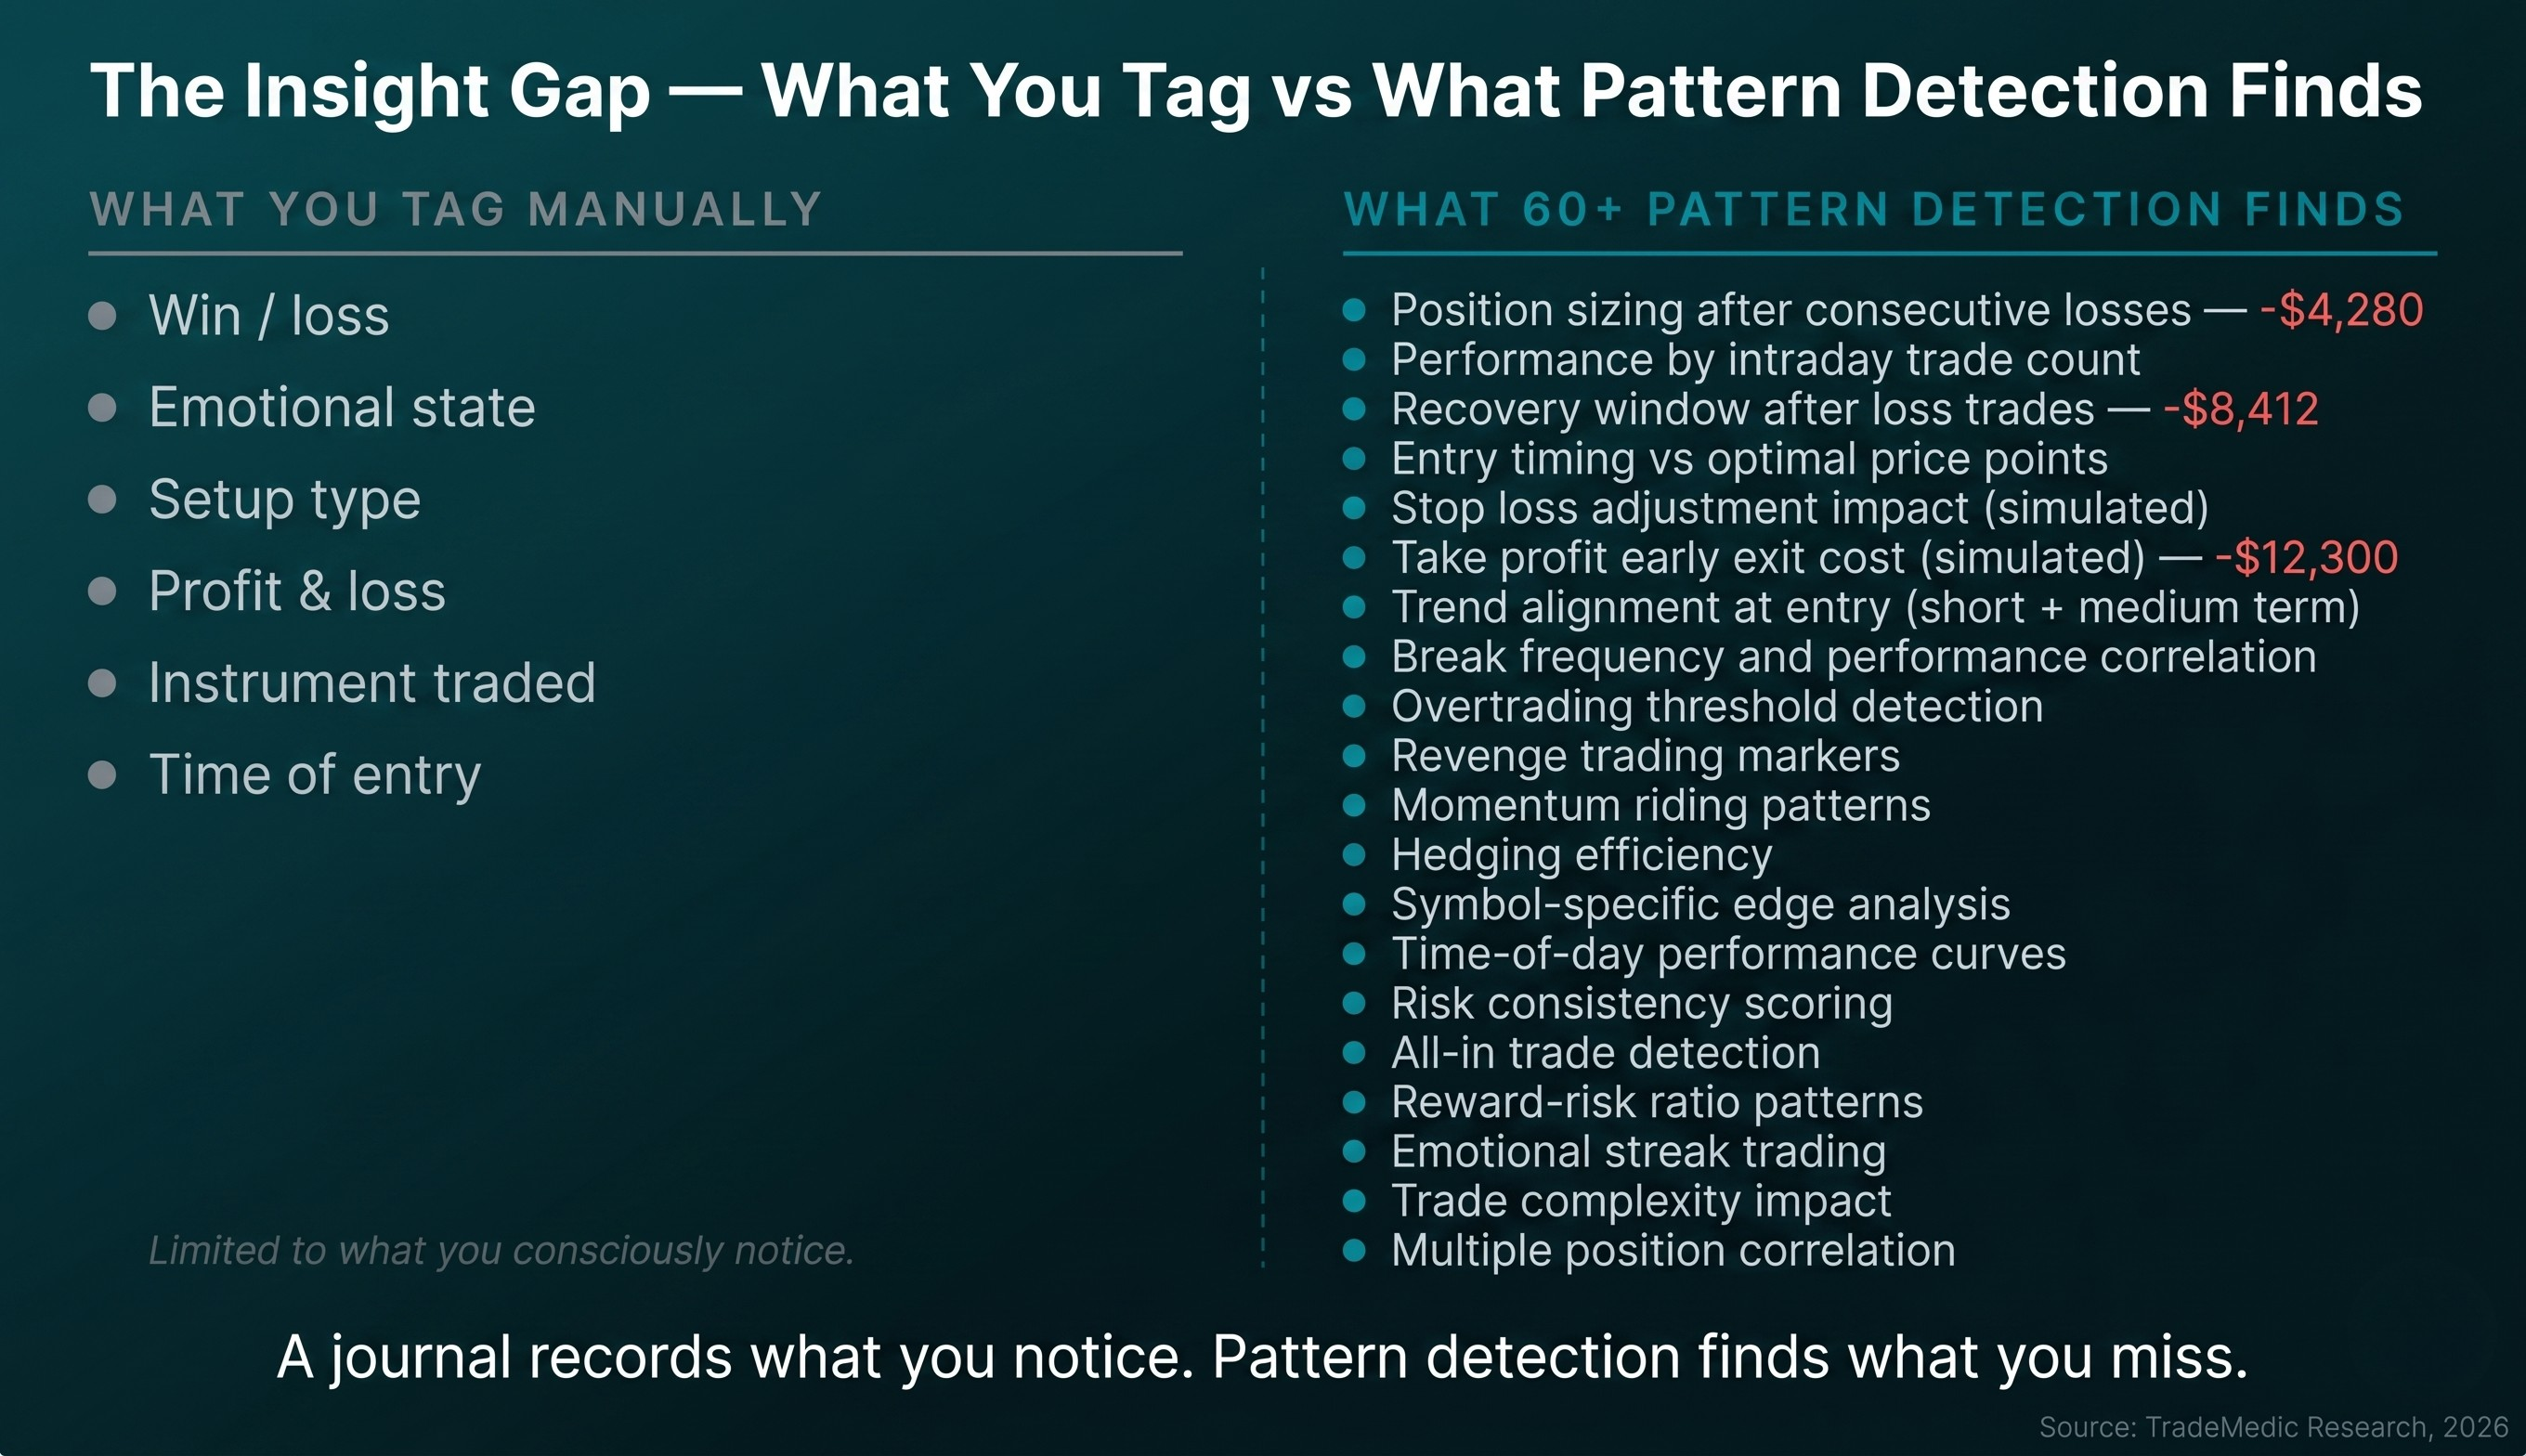
Consider a trader who journals every trade for a year. They record entry and exit prices, position sizes, instruments, their emotional state, and their rationale. They review their journal monthly. What can they find? They can find that they trade gold worse than forex pairs. They can find that their win rate drops on Fridays. They can find that they feel frustrated after consecutive losses. These are useful insights.
Now consider what they cannot find. They cannot see that their position sizing systematically increases by 35% after two consecutive losses, because they never thought to measure that specific variable. They cannot see that their performance degrades significantly after the fourth trade of the day, because they never segmented their data by intraday trade count. They cannot check whether the time they wait after a losing trade before entering the next one correlates with the outcome, because they never logged recovery intervals in minutes, let alone correlated those intervals with performance. They cannot list every price point their instrument traded at in the minutes before and after their entry to see whether they are consistently entering too early or too late, because that data is not available in their trading platform’s history. They cannot simulate whether the 147 trades they closed manually in profit would have performed better if they had let their original take profit stand, because running that counterfactual requires price data and computation their journal does not have.
These are not obscure edge cases. These are among the most common patterns in a dataset of 500,000+ trading accounts. They are patterns that an automated system detects within minutes of connecting to a trader’s account. And they are patterns that almost no trader would think to look for in their journal, because you cannot search for something you do not know exists.
This is the fundamental difference between self-reported observation and systematic pattern detection. A journal records what you notice. An automated system searches for correlations you never thought to check.
What trading journals miss that costs you money
The distinction between a journal and automated behavioural analytics is not about features. It is about what each tool is fundamentally designed to do.
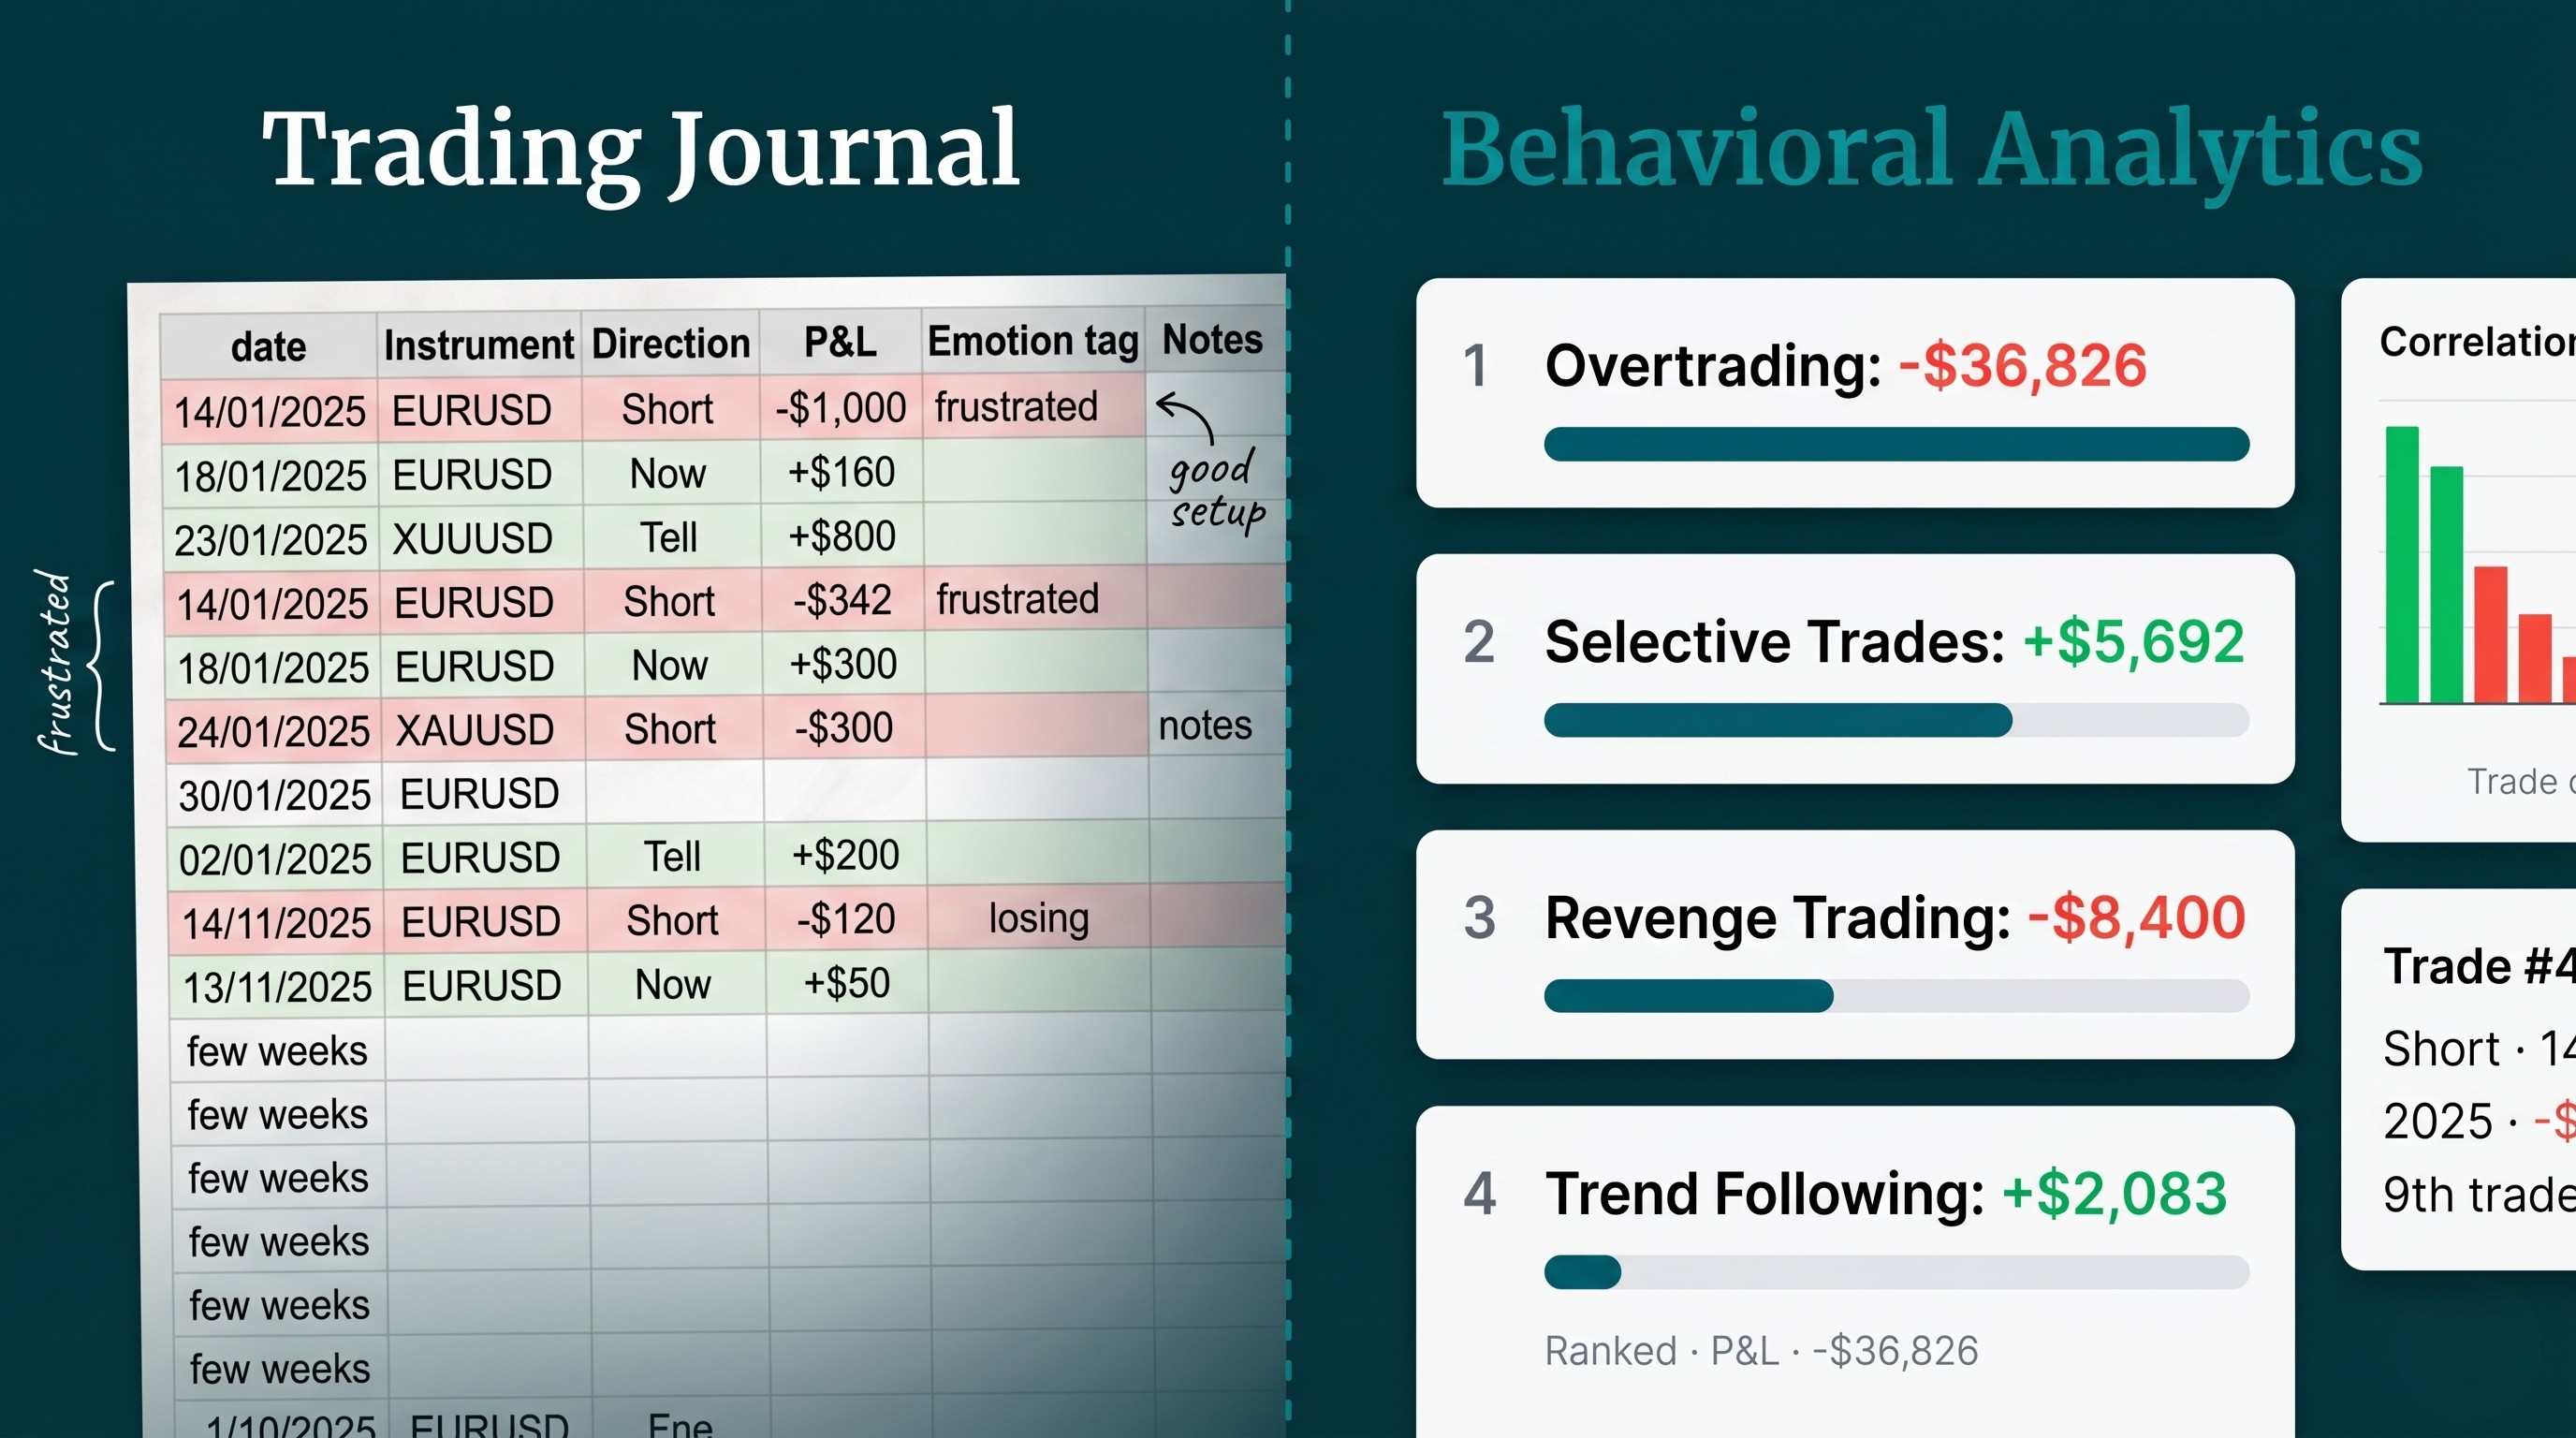
A journal records your trades and shows you descriptive statistics: your win rate, your average win and loss, your P&L over time, maybe your performance by instrument or time of day. These are useful numbers, but they describe what happened. They do not explain why.
Behavioural analytics does something different. It looks for correlations between specific trading conditions and your outcomes. Not just “what was my win rate” but “how does my win rate change depending on how many trades I have already taken today?” Not just “what was my P&L on gold” but “what happens to my gold performance when I enter against the short-term trend?” Not just “I had a bad week” but “you lost $12,400 specifically because you adjusted your stop loss further from your entry on 23 trades this month, and if you had left the original stop in place, 17 of those trades would have performed better.”
That last example illustrates the real difference. The journal would show that the week was bad. The analytics would show exactly which behaviour made it bad, quantified in dollars, with specific trade IDs as evidence. One gives you a feeling that something is wrong. The other tells you precisely what is wrong and how much it cost.
The 60+ patterns that TradeMedic™ AI analyses across each trader’s account include behavioural patterns (overtrading, emotional trading, insufficient breaks between sessions), strategic patterns (fighting the trend, inefficient hedging, over-complexity in instrument selection), trade execution patterns (premature profit-taking, stop loss mismanagement, poor entry timing), and risk management patterns (position sizing inconsistency, excessive risk on single trades, missing stop losses). Each pattern is quantified in dollar terms as a performance effect: the total amount that behaviour has cost or earned the trader across their entire trading history.
Why your journal has no benchmark
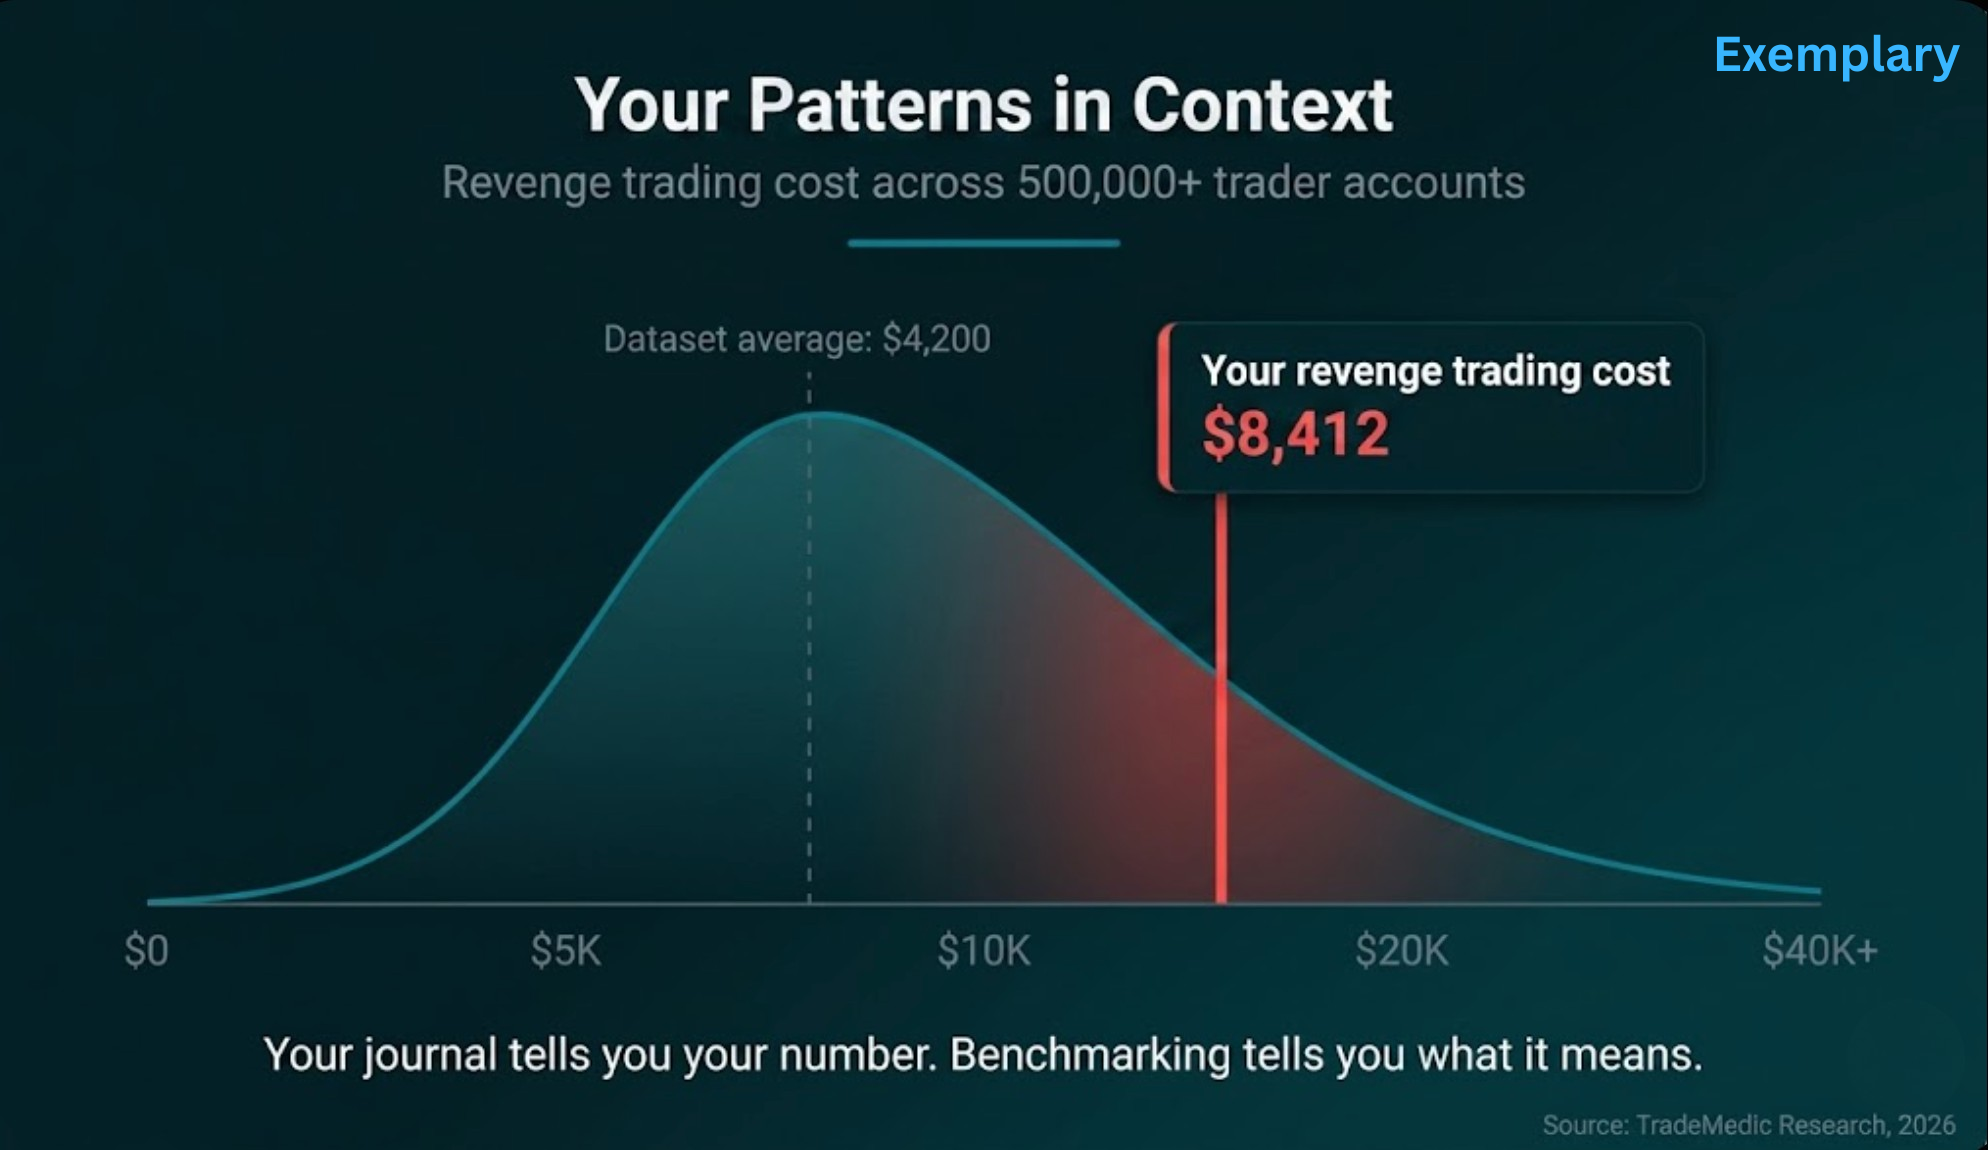
One of the most overlooked limitations of trading journals is the absence of context. Your journal tells you your patterns. It does not tell you whether those patterns are normal, severe, or unusual compared to other traders.
Imagine you discover from your journal that you overtrade on volatile days. Is that a serious problem? Is it costing you significantly or marginally? Do most traders do the same thing, or is your behaviour unusual? Without a reference population, you have no way to calibrate. Every pattern exists in isolation, and you cannot tell which ones deserve urgent attention and which ones are normal variation.
TradeMedic™ AI analyses behaviour across 500,000+ trading accounts. When it identifies a pattern in your data, it is not comparing you to an abstract ideal. It is comparing you to a massive dataset of real traders with real outcomes. The platform ranks your patterns by dollar impact, so you see which behaviours are costing you the most money first. The 8-point trading area assessment scores you across behavioural errors, emotional errors, strategic errors, trade execution, risk management, and more, each calibrated against what the data shows for the broader trader population. Moreover, it can also find your strength and calibrate it. For example, 59% of traders showing strength during low market volatility are profitable, while only 12% that do not are. This compares to an overall 18% benchmark of profitable traders.
This benchmark dimension is something no journal can provide, regardless of how diligently you maintain it. Your journal is an n of 1. Behavioural analytics gives you the context of 500,000.
How automated behavioural analytics works
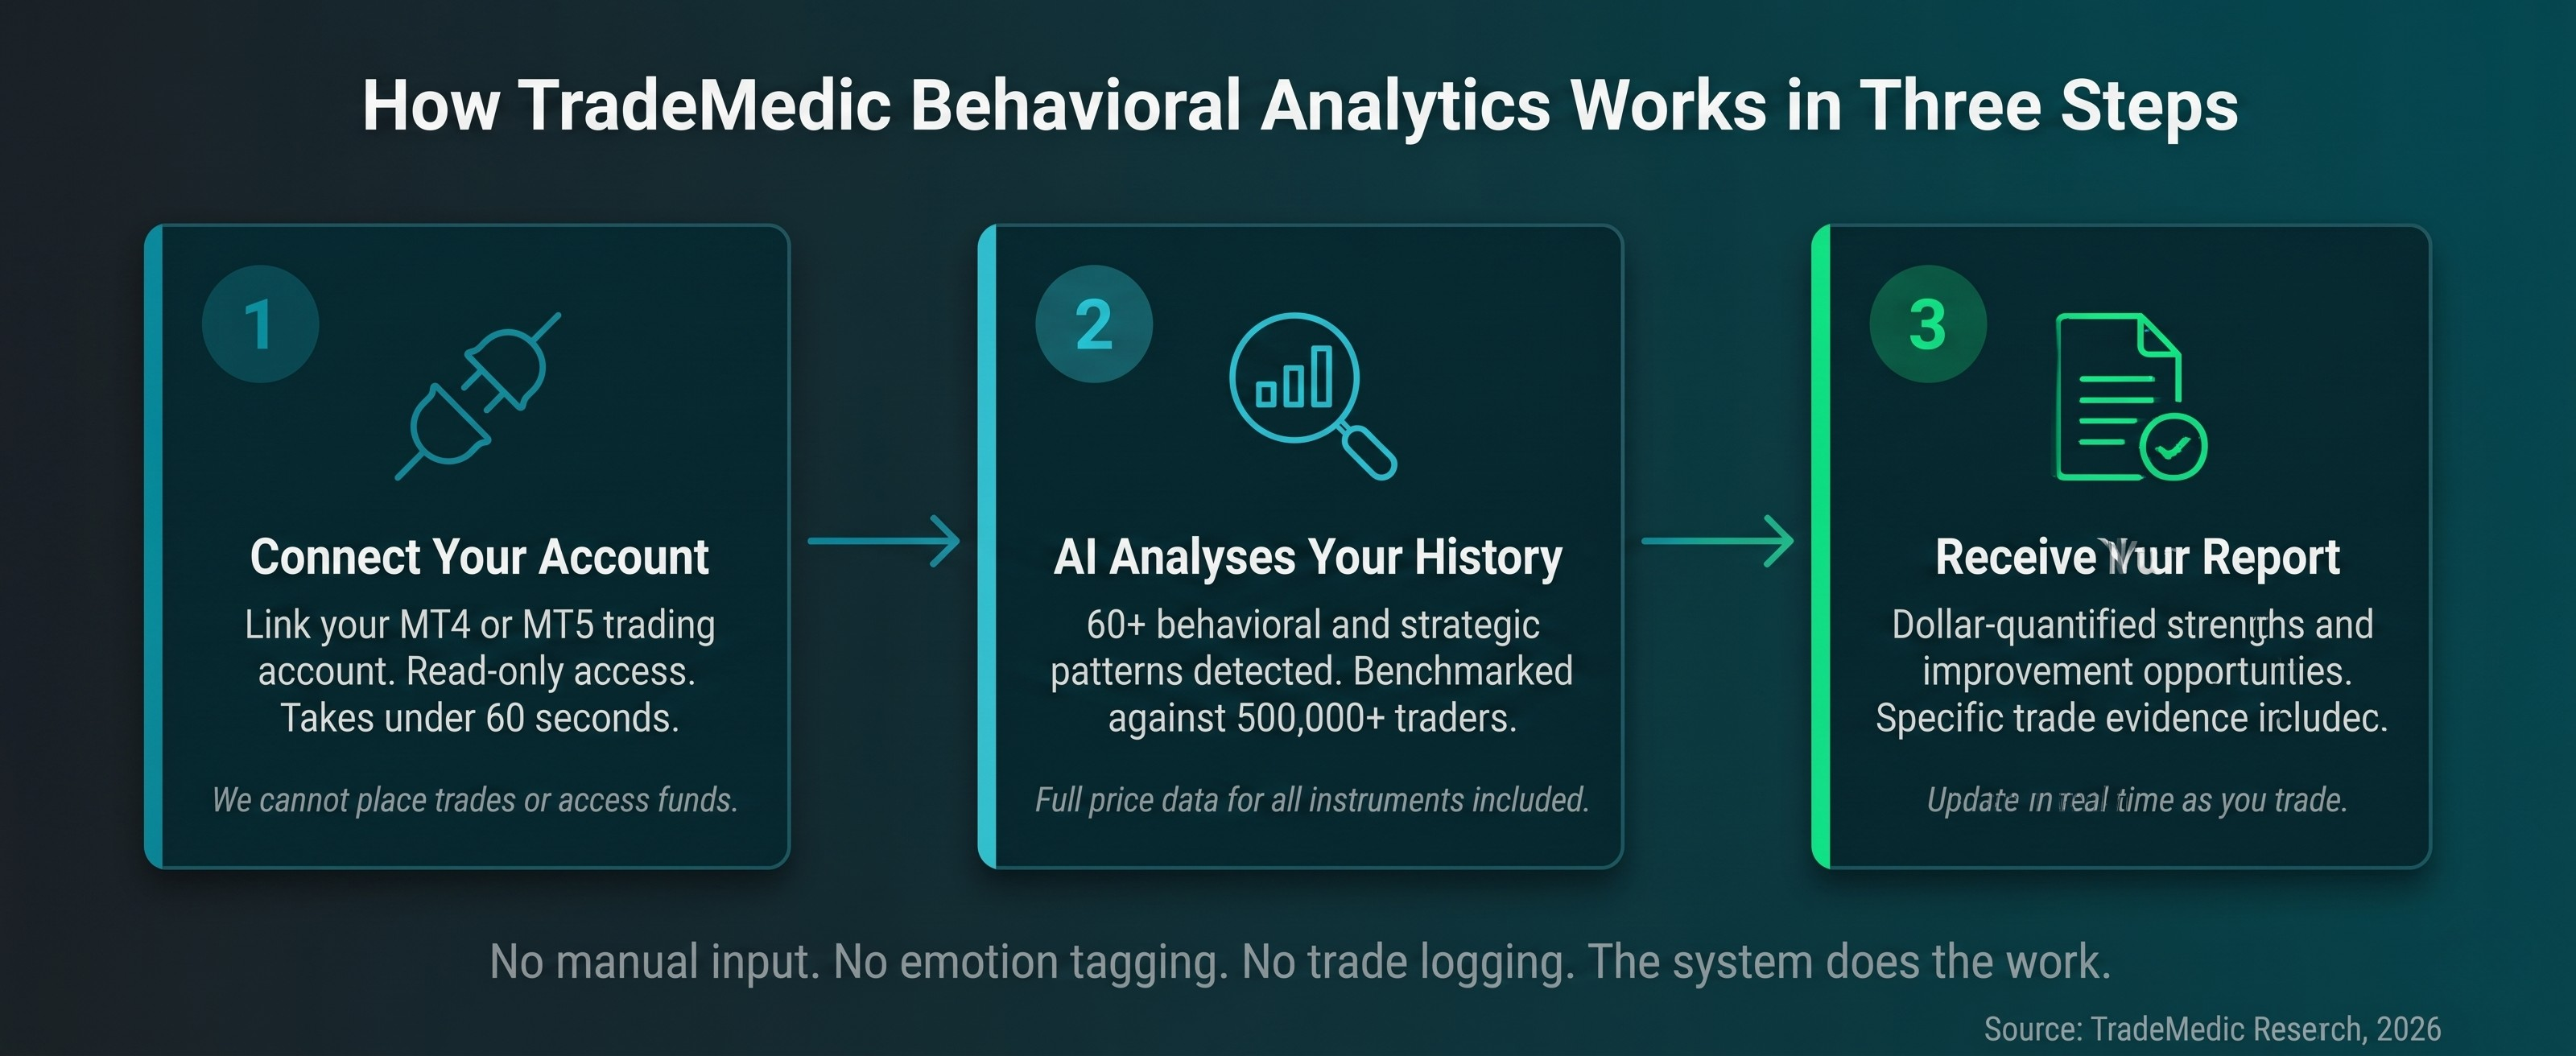
The process is simpler than journaling. There is no manual data entry, no emotion tagging, no nightly logging ritual.
You connect your MT4 or MT5 trading account through a read-only API connection. The system cannot place trades, access funds, or modify your account in any way. It reads your trade history: entries, exits, timestamps, instruments, position sizes, and outcomes. Alongside your trade data, the system continuously logs the prices of all instruments you trade, so it knows exactly what happened in the minutes before and after each of your trades, how your stop loss and take profit adjustments played out against actual price movements, and what would have happened under different scenarios.
The AI then analyses your complete trading history across 60+ behavioural and strategic patterns. For each pattern, it segments your trades by a specific behavioural dimension (for example, how many trades you had already taken that day, whether you were trading with or against the trend, how long since your last break, whether you had adjusted your stop loss), measures the correlation between that dimension and your performance, and quantifies the dollar impact.
The output is a ranked list of your strengths and improvement opportunities, each with a specific dollar value attached. Your top strength might be trend following, worth $5,692 in additional profit. Your biggest improvement opportunity might be overtrading, costing you $36,826 across your trading history. Each finding includes an explanation, a personalised insight sentence using your actual data, a correlation chart showing the pattern the algorithm detected, and specific trade examples with real trade IDs, dates, and profit figures.
The report updates in real time as you continue trading. No manual input required at any point.
What this looks like in practice
The following examples are representative of patterns commonly detected across the TradeMedic dataset. The specific numbers come from real analysis, though individual reports will vary based on each trader’s history.
Consider a trader who has been journaling for six months. They know their win rate (54%), their best instrument (EURUSD), and their worst trading day (Friday). They have noted in their journal that they “feel rushed” on some days and that their performance seems worse when they trade too much. These are reasonable observations from a well-maintained journal.
When the same trader connects their account to TradeMedic™, the automated analysis reveals something more specific. Their performance does not just degrade “when they trade too much.” It degrades sharply after their seventh trade of the day, with trades 8 through 15 averaging a loss of $14.20 per trade compared to a gain of $17.35 per trade for trades 1 through 6. The total cost of this overtrading pattern across their history is $36,826. The system also detects that on days where they trade fewer than seven times, their win rate is 61%, not the 54% they calculated from their journal (which included all trades, diluting the signal with the overtrading noise).
The journal told them they trade too much sometimes. The analytics told them exactly when it starts costing money, how much it has cost, and that their true edge is significantly stronger than they believed once the noise is removed. Those are two very different levels of insight, and only one of them is specific enough to drive a concrete behaviour change.
The same trader’s report also flags a revenge trading pattern. The system measures the time interval between a losing trade and the next entry. Trades taken within 10 minutes of a loss show significantly worse performance than trades taken after a longer recovery window. The trader’s journal might note “I felt frustrated after the loss” but it cannot tell them that their specific recovery window, the exact number of minutes after which their performance normalises, is something they can measure and use as a concrete rule. This is one of the most common patterns in the dataset, and it connects directly to the revenge trading research.
The report also runs a simulation on every trade the trader closed manually in profit. Of the 147 trades they exited early, 89 would have reached their original take profit level. The total profit left on the table: $12,300. The trader’s journal recorded these as winning trades. The analytics reveals they were winning trades that should have won more. Without the simulation against actual price data, there is no way to know whether early exits are helping or hurting, because the journal only records what happened, not what would have happened.
Can you use both a journal and analytics?
Yes. Some traders find value in continuing to journal alongside automated analytics, but for different purposes than before.
A journal is useful for capturing context that trade data alone cannot provide. Your thesis for a trade, the market conditions you observed, a piece of news that influenced your decision, your general state of mind that day. These are qualitative observations that enrich your understanding of specific trades. The analytics handles the quantitative pattern detection, the benchmarking, and the blind-spot-proof behavioural analysis.
If you use both, the division is clear. The journal records context. The analytics finds patterns. You do not need to log every trade in your journal or tag emotions for statistical analysis, because the system already handles that. The journal becomes lighter and more focused: a place for reflection, not data entry.
If you can only do one, the analytics provides the insights that actually drive behaviour change. It finds patterns you would never have searched for, quantifies their impact, benchmarks you against 500,000 traders, and updates in real time without requiring you to do anything. The journal requires consistent effort and produces insights limited to what you already know to look for. For most traders, the decision comes down to which tool produces the insights that actually change their behaviour.
What does the data say about trading patterns?
TradeMedic™ AI analyses trading behaviour across a dataset of 500,000+ trader accounts, identifying over 60 distinct behavioural patterns that correlate with trading performance. The patterns span behavioural errors (overtrading, emotional trading, trading without sufficient breaks), strategic errors (fighting the trend, inefficient hedging), trade execution issues (premature profit-taking, stop loss mismanagement), and risk management problems (reward risk imbalance, excessive risk).
For traders who receive their TradeMedic report, every pattern is quantified in dollar terms: the exact amount that behaviour has cost or earned them. The report includes specific trade examples with real trade IDs, dates, and outcomes. It updates in real time. And it requires no manual input beyond connecting a trading account.
The most common observation from traders who move from journaling to automated analytics is not that they discover entirely new behaviours. It is that they discover the severity and frequency of behaviours they vaguely knew about but had never quantified. Knowing you “sometimes overtrade” is different from seeing that overtrading has cost you $36,826 across 1,200 trades, with your own account ID at the top of the page and your own trade IDs listed as evidence. Every trader knows overtrading is bad. Seeing your personal dollar figure next to the specific trades that caused it is what turns knowledge into action.
The right tool for what you are actually trying to do
If you stepped back and described what you want from a trading journal, you would probably say something like: I want to understand my trading patterns, see what is costing me money, and know what to change. You would not say: I want to spend an hour a week logging data into a spreadsheet.
The journal was the best tool available when manual observation was the only option. It is still better than nothing. But the question you should ask is not whether you should keep a journal. It is whether there is a more effective way to achieve what the journal was supposed to do.
Connect your trading account. Let the system find the patterns. See the dollar impact. Compare yourself against 500,000 traders. And spend the time you would have spent journaling on actually improving the specific behaviours that are costing you the most.
Source: TradeMedic Research, 2026

